Request a Quote
Share the equipment and project requirements. If you need help selecting a model, describe the application.
Have drawings or specifications? Email [email protected] with your project reference.

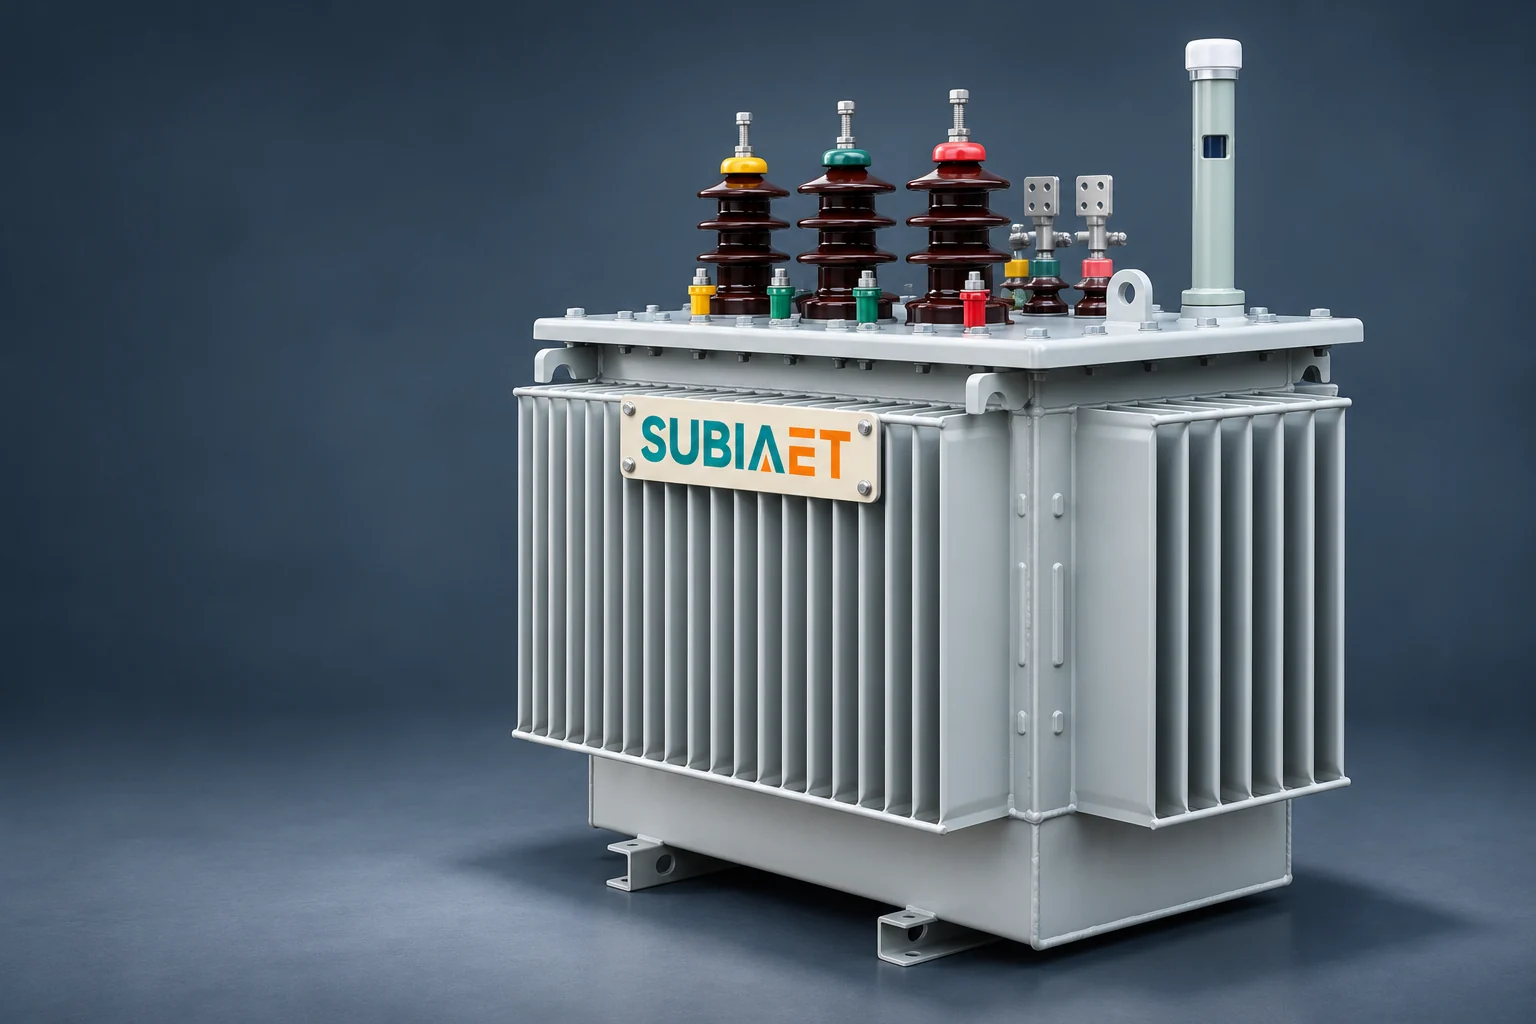
Transformer percent impedance is one of the most concise and consequential numbers on a nameplate. It helps determine the transformer contribution to fault current and is one input to a loaded-voltage calculation. Yet the same value interacts differently with fault calculations than it does with voltage-drop estimates, and neither calculation is complete without understanding the base conditions the percentage is defined against. This article defines percent impedance from first principles, works through two numerically verified fault examples on the same transformer base, shows how load power factor separates voltage drop from the impedance magnitude, and identifies the data and tradeoffs that matter before specifying a value.
Transformer short-circuit impedance is defined as the equivalent series resistance plus reactance of the transformer, measured at rated frequency and a stated reference temperature, for a specific winding pair. The word “percent” means the impedance is expressed relative to a base, not as an ohmic value in isolation.
One useful way to understand the percentage physically is this: it represents the reduced AC voltage that must be applied to one winding, with the other winding short-circuited under controlled measurement conditions, in order to produce rated current in that winding. When that test voltage is divided by the corresponding rated winding voltage and multiplied by 100, the result is the percent impedance. A 5% value therefore means that the test voltage is 5% of the supplied winding’s rated voltage under those measurement conditions. Schneider Electric’s transformer specification paper illustrates the measurement concept.
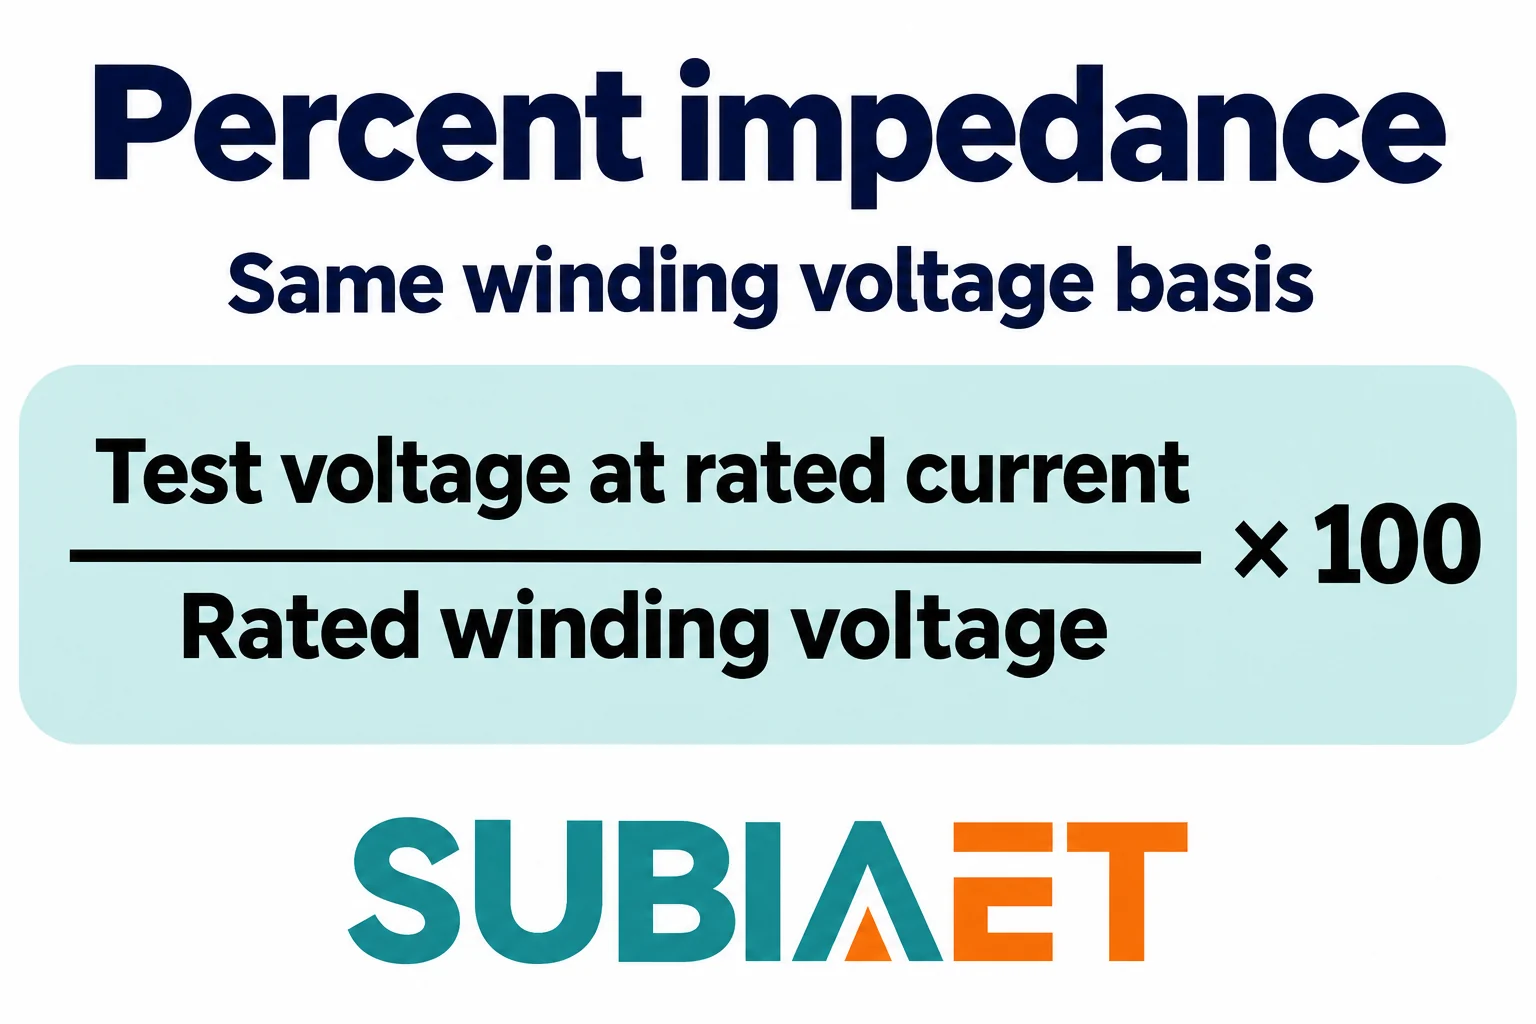
For calculations involving three-phase power systems, the per-unit base impedance that normalizes this percentage is derived from the rated line-to-line voltage and rated three-phase apparent power of the transformer. The base impedance in ohms is V_LL² / S_3phase, using V_LL in volts for the line-to-line voltage base and S_3phase in volt-amperes for the total three-phase apparent-power base. At 5% impedance, the per-unit value used in calculations is z = 0.05. At 7.5%, it is z = 0.075. The percentage and the per-unit value are interchangeable once you confirm the base they are defined on.
Several conditions travel with every percent impedance figure and must match between the nameplate, the impedance value and your study basis before you use the number:
Percent impedance is not the same as measured running voltage regulation under load. Voltage regulation under actual loading conditions depends on the R and X components separately and on the load power factor, as the next sections show.
To see how percent impedance controls fault current, consider two hypothetical 1250 kVA, 480 V line-to-line, three-phase distribution transformers. The two have the same stated kVA and voltage bases: one is specified at 5% impedance and the other at 7.5%. Both are set at the rated tap. The source upstream of each is assumed ideal: before the fault, the secondary open-circuit voltage is exactly 480 V line-to-line. No upstream source impedance is included, and no downstream cable, bus, or other impedance is added between the transformer terminals and the fault point. The fault scenario is a bolted symmetrical three-phase fault at the low-voltage terminals.
Step 1 — Rated current
The three-phase rated current at 480 V is:
I_rated = S_3phase / (√3 × V_LL) = 1,250,000 VA / (1.7321 × 480 V) = 1,503.5 A
Step 2 — Simplified fault current
With negligible upstream source impedance, the simplified symmetrical three-phase terminal fault current is:
I_sc ≈ I_rated × (100 / %Z)
For 5% impedance:
I_sc = 1,503.5 A × (100 / 5) = 1,503.5 × 20 ≈ 30.1 kA RMS
For 7.5% impedance:
I_sc = 1,503.5 A × (100 / 7.5) = 1,503.5 × 13.33 ≈ 20.0 kA RMS
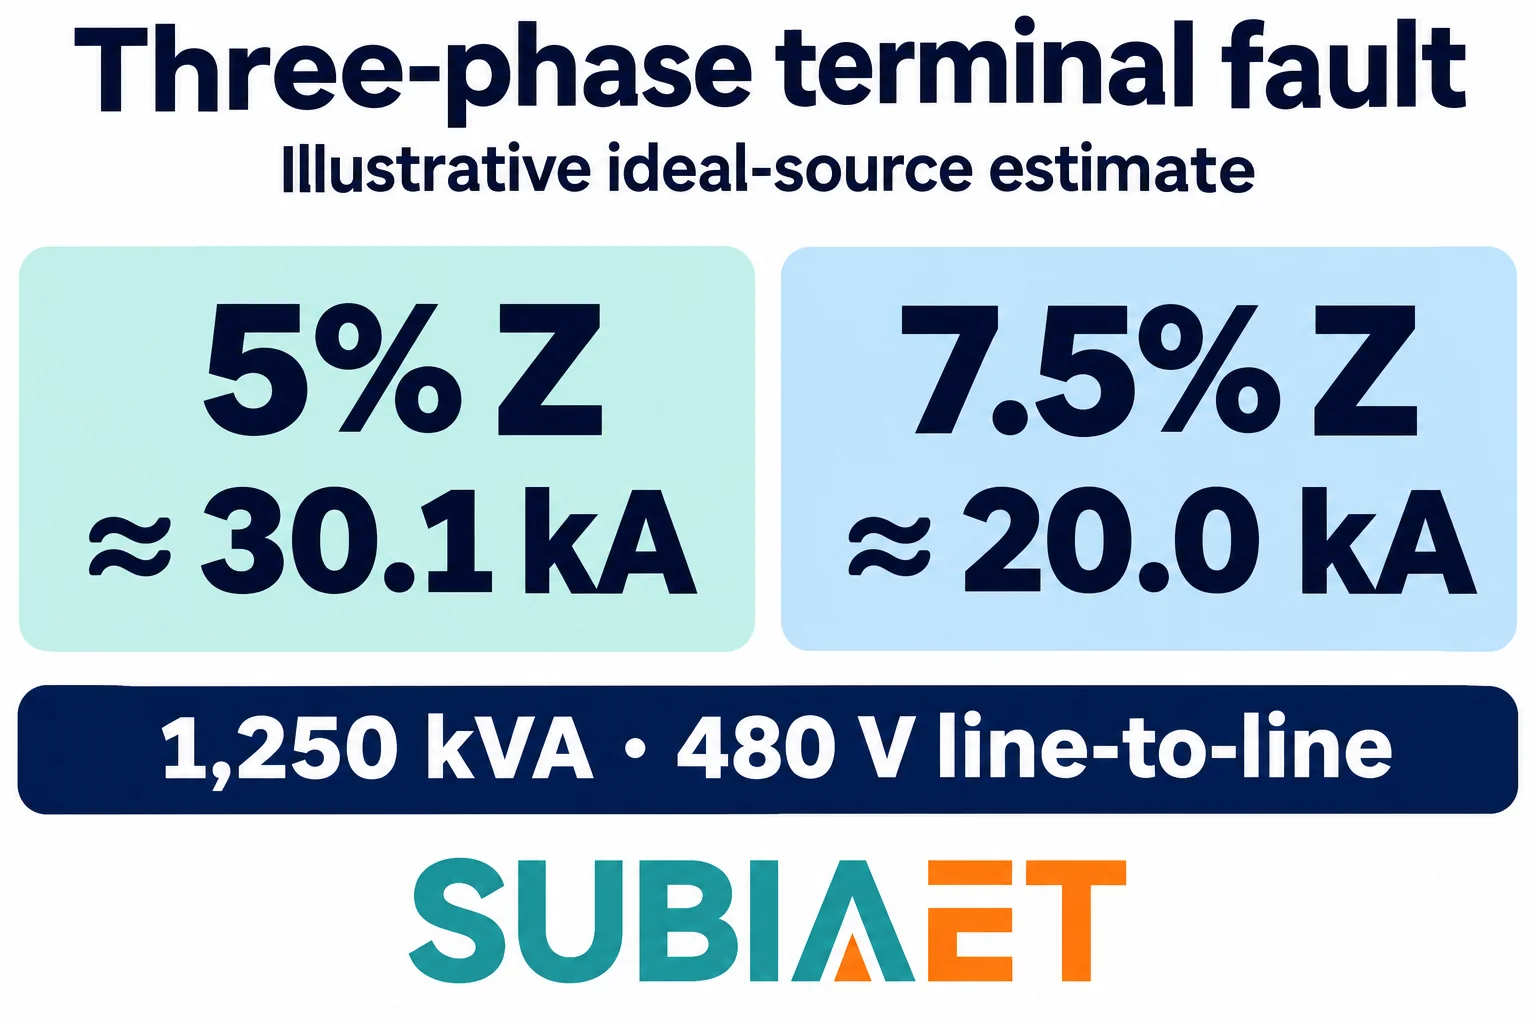
The result is straightforward: increasing the denominator by a factor of 1.5, from 5% to 7.5%, reduces the simplified fault current to about two-thirds. Higher percent impedance limits the current that can flow into a bolted fault at the transformer terminals.
What this example does and does not represent
These two estimates are built on a highly simplified model: ideal voltage source, no upstream impedance, no cable, no bus, and no other fault-current contributions such as induction motors connected to the same bus. In a real project, the available fault current at any point in the distribution system depends on the combined impedances of the upstream source, the transformer, all conductors from transformer terminals to the fault point, and any rotating machine contributions. A formal short-circuit study covers the applicable contributions and uses the required method for the project. The ideal-source example here is only a simplified terminal estimate. Schneider Electric’s terminal fault example uses this simplification.
The percent impedance figure used in a fault study also needs to account for manufacturing tolerance on the nameplate value, which is why guaranteed tolerance bands matter when specifying a transformer for a tight protection coordination margin.
One additional boundary is important: the fault current magnitude calculated in a short-circuit study is distinct from the transformer’s ability to withstand that fault current thermally and dynamically. Withstand capability is a separate equipment property addressed under its own standards and established by separate evidence from the manufacturer; the nameplate percent impedance does not by itself certify any withstand level. IEC 60076-5 addresses withstand within its stated scope.
The percent impedance magnitude |Z%| follows from the resistive and reactive components: |Z%|² = R%² + X%². For the 5% example, suppose the transformer has R = 1.00% and X = √(5² − 1²) = √(25 − 1) = √24 ≈ 4.90%, both on the same base. These are illustrative values that satisfy the 5% magnitude.
With primary voltage and tap held fixed, the approximate internal voltage drop at rated current is:
ΔV% ≈ R% × cos φ + X% × sin φ (for lagging power factor)
This first-order approximation shows that the result depends on the phase angle of the load current, not just on |Z%|. Here φ is the angle by which the current lags the terminal voltage. Schneider Electric’s supply-voltage example uses this relationship.
Case 1 — Unity power factor (cos φ = 1, sin φ = 0)
ΔV% ≈ 1.00 × 1 + 4.90 × 0 = 1.00%
Case 2 — 0.80 lagging power factor (cos φ = 0.80, sin φ = 0.60)
ΔV% ≈ 1.00 × 0.80 + 4.90 × 0.60 = 0.80 + 2.94 = 3.74%
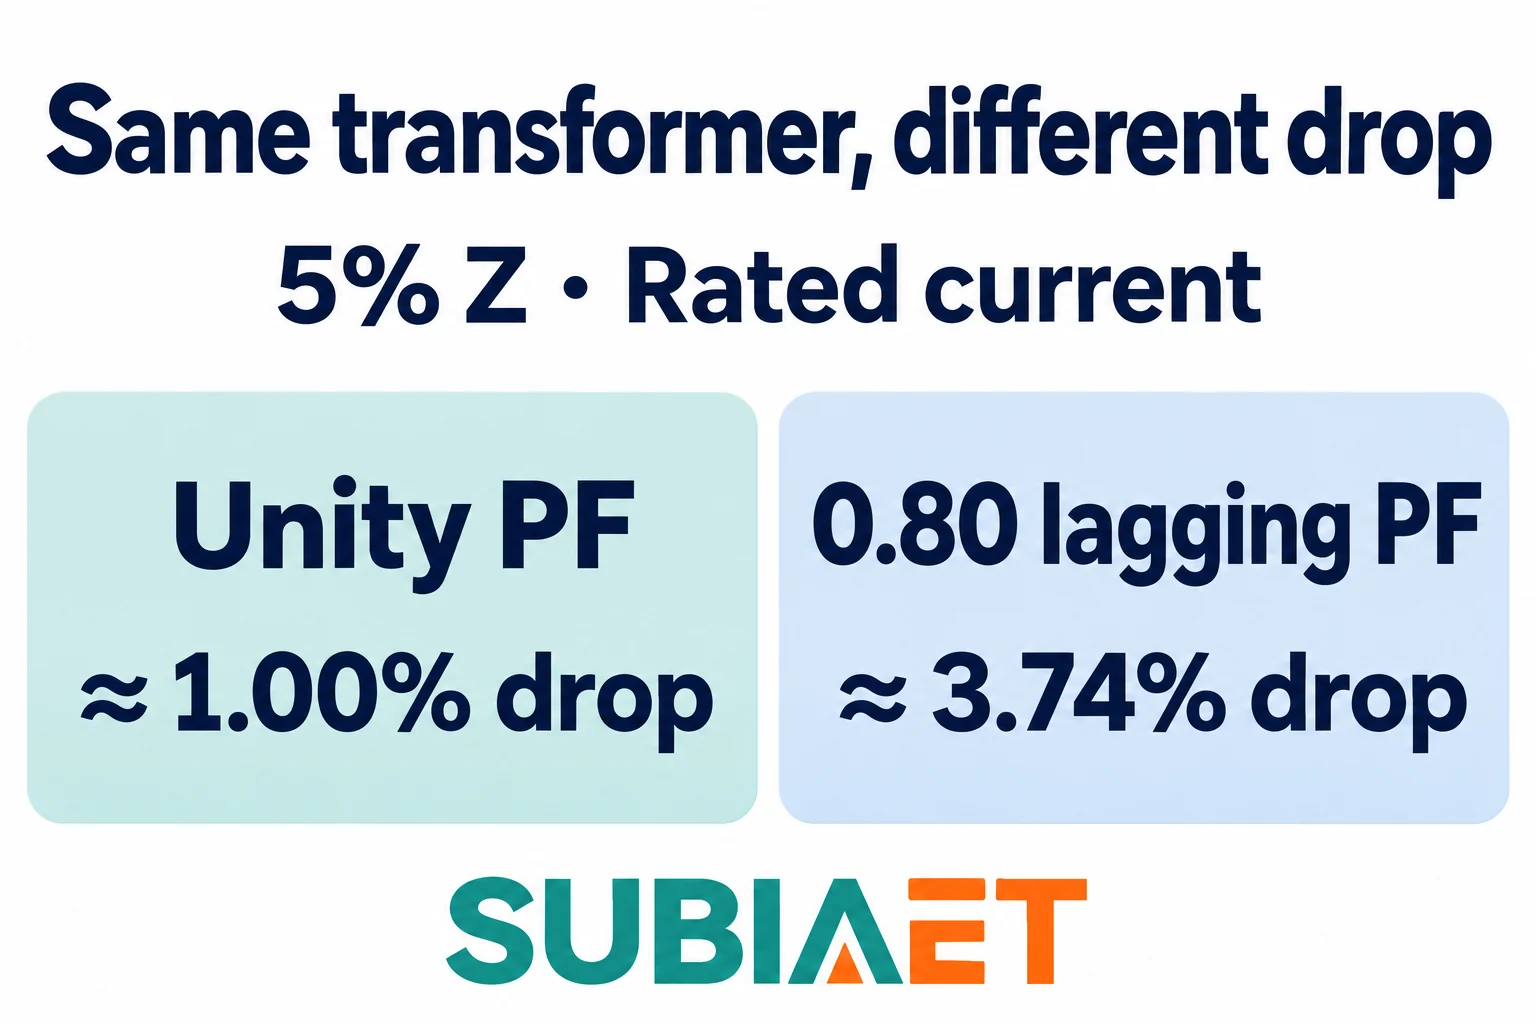
The same transformer with the same 5% impedance magnitude produces a 1.00% voltage drop feeding a purely resistive load at full current, and a 3.74% drop feeding the same full-rated current at 0.80 lagging power factor. The reactive component X dominates most of the difference: a highly inductive load (lagging current) multiplies the reactance drop by sin φ, which is non-zero and often substantial.
This has several practical consequences:
Partial load: The first-order result scales with the fraction of rated current. At 50% of rated current and 0.80 lagging power factor, the drop falls to approximately half: 1.87%.
Leading power factor: For capacitive loads or over-excited synchronous machines drawing leading current, the reactive term changes sign. The formula becomes ΔV% ≈ R% × cos φ − X% × sin φ. A transformer terminal voltage can actually rise above the no-load open-circuit value under a sufficiently leading load. Check this possibility in the actual voltage study where leading current can occur; it is not established by |Z%| alone.
Motor starting: Induction motor starts can draw elevated current at lagging power factor. Use the actual motor and starting-method data for both quantities. A starting dip can exceed the running-load drop because of the magnitude and phase angle of the starting current. Motor starting is a separate transient study that requires the starting current magnitude and power factor alongside the transformer impedance.
R/X ratio matters: Two transformers with the same |Z%| but different internal R and X splits can produce different voltage drops at the same load power factor. At unity power factor the first-order estimate uses R alone; at lagging power factor both terms contribute. Evaluate their actual values and the load angle rather than ranking voltage performance from |Z%| alone.
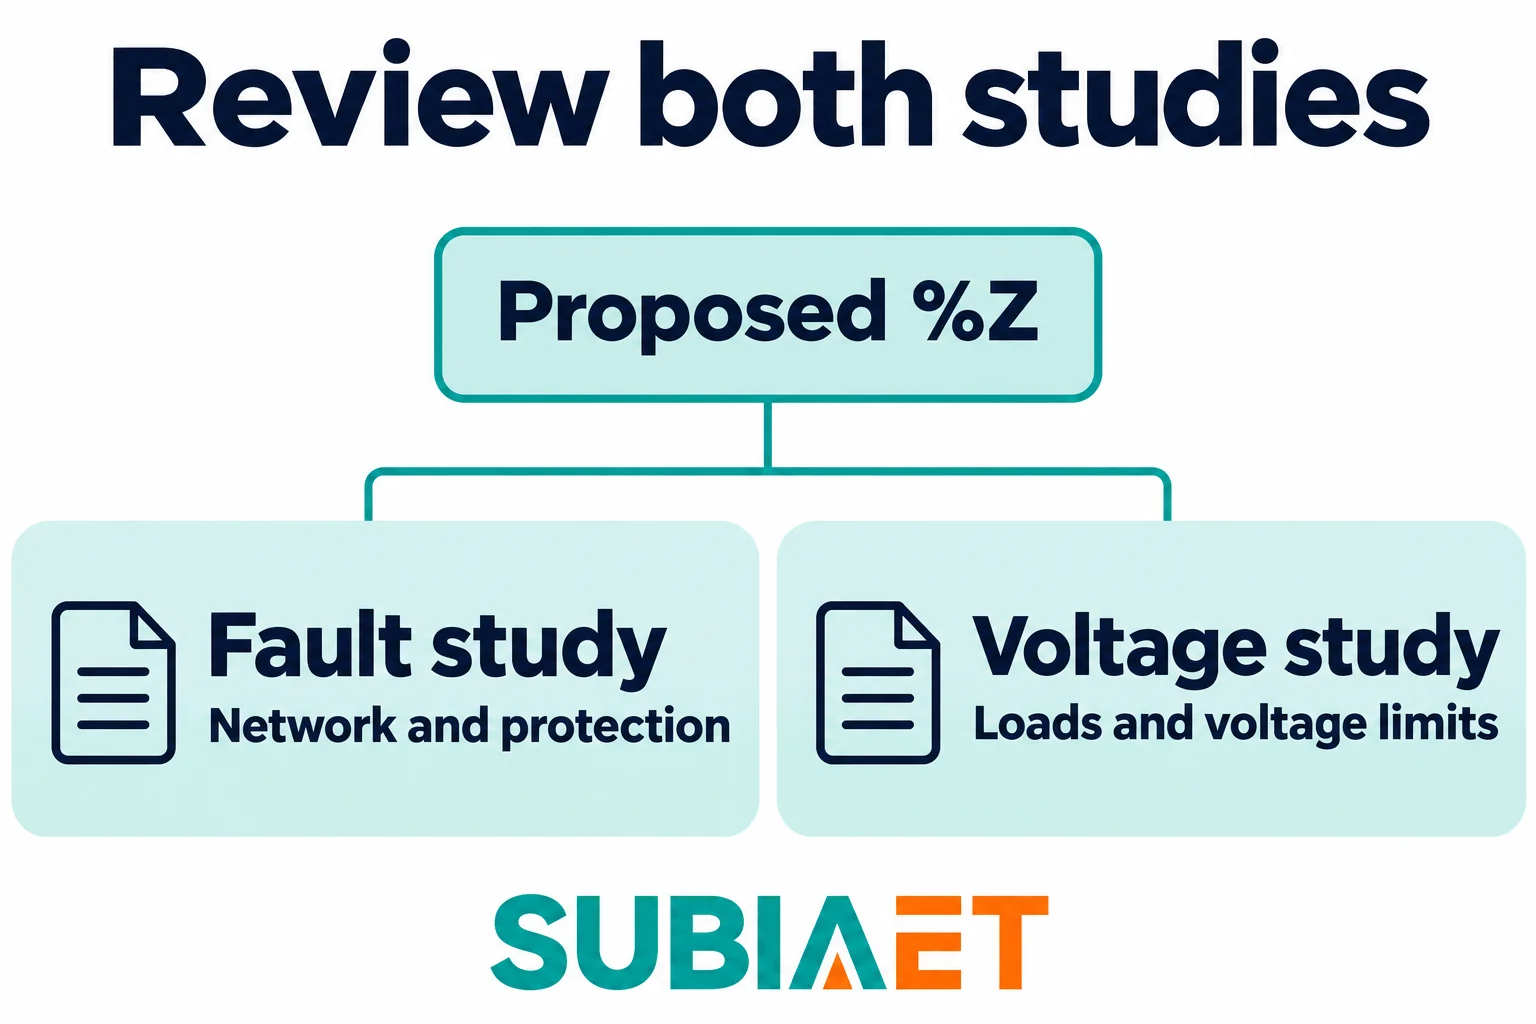
Percent impedance is an input, not an answer. Before specifying or accepting a value, an engineering team typically runs at least two separate checks against the same candidate transformer: a fault study and a voltage-performance assessment. These address different system requirements and can point in opposite directions for the choice of impedance.
Fault study checks
A fault study for the transformer determines whether downstream equipment has adequate fault current rating and whether protection devices coordinate correctly over the full range of fault magnitudes. The key inputs beyond the transformer’s own %Z include:
Lower impedance increases the maximum available fault current and can stress switchgear, fuses, and conductors. Higher impedance reduces the transformer-only symmetrical RMS fault estimate on the same base but can also reduce the minimum fault current that must be detected reliably by protection, which matters for relay settings at the far end of long feeders.
Voltage performance checks
A voltage-performance assessment determines whether the transformer keeps load voltages within acceptable limits across expected demand levels. The key inputs include:
What to request from a supplier
When specifying a transformer for a project where both fault coordination and voltage performance matter, ask for the guaranteed percent impedance and its manufacturing tolerance on the rated kVA-voltage base and at the expected tap position. The guaranteed tolerance tells you the range within which the actual delivered unit must fall. That range directly determines the spread of calculated fault currents in your study.
For the R and X split, the transformer’s total rated load loss on the matching test and reference basis can be used to establish an equivalent resistive component. Keep the current, kVA and temperature bases consistent; load loss includes additional load-related losses as well as winding I²R. The reactive component follows from the geometry. If your voltage study is sensitive to the R/X ratio, request the load-loss watts and no-load-loss watts separately rather than relying only on the total |Z%|.
Withstand capability — the ability to survive the thermal and dynamic effects of an external short circuit — is established separately from the nameplate %Z figure and from the network fault current estimate. It requires its own evidence from the manufacturer.
No universal preferred impedance
There is no universal rule that lower or higher percent impedance is better. A project with a tight running-voltage budget must evaluate current, power factor, taps and the R/X components as well as magnitude. A project with existing downstream equipment must check the available fault duties against its ratings. The two assessments can point in different directions. Run both studies and identify whether a proposed impedance range satisfies the requirements, including the agreed tolerance. If no candidate satisfies both, review the system or equipment arrangement instead of assuming that one preferred percentage will solve the conflict.
If you need to locate the percent impedance figure on a physical nameplate or procurement document, the transformer nameplate reading guide explains what to look for and how the nameplate fields relate to each other, including where the kVA base, voltage base and tap position are stated.
For the broader selection decision — including cooling class, insulation level, installation environment and specification inputs beyond impedance — the industrial transformer selection workflow covers the full set of project-specific parameters.
The downstream equipment that must be rated for the fault current flowing out of the transformer secondary is discussed in the low-voltage switchgear category, which provides the interface between transformer fault study results and equipment selection.
The 5% value is the impedance magnitude on the stated base. Running voltage drop depends on the load current, power factor and the resistance and reactance components.
The example keeps the rated current and pre-fault voltage the same, so the higher per-unit impedance gives a lower symmetrical terminal fault estimate. A network study also accounts for the other impedances and sources.
Yes. The same percentage can correspond to different ohmic values when the voltage or kVA bases differ. Refer both values to a common basis for a system calculation.
Ask for the guaranteed percentage, tolerance and the winding pair, rating base, tap, frequency and temperature to which it applies. Request separate R/X data if your voltage study needs it.