Request a Quote
Share the equipment and project requirements. If you need help selecting a model, describe the application.
Have drawings or specifications? Email [email protected] with your project reference.

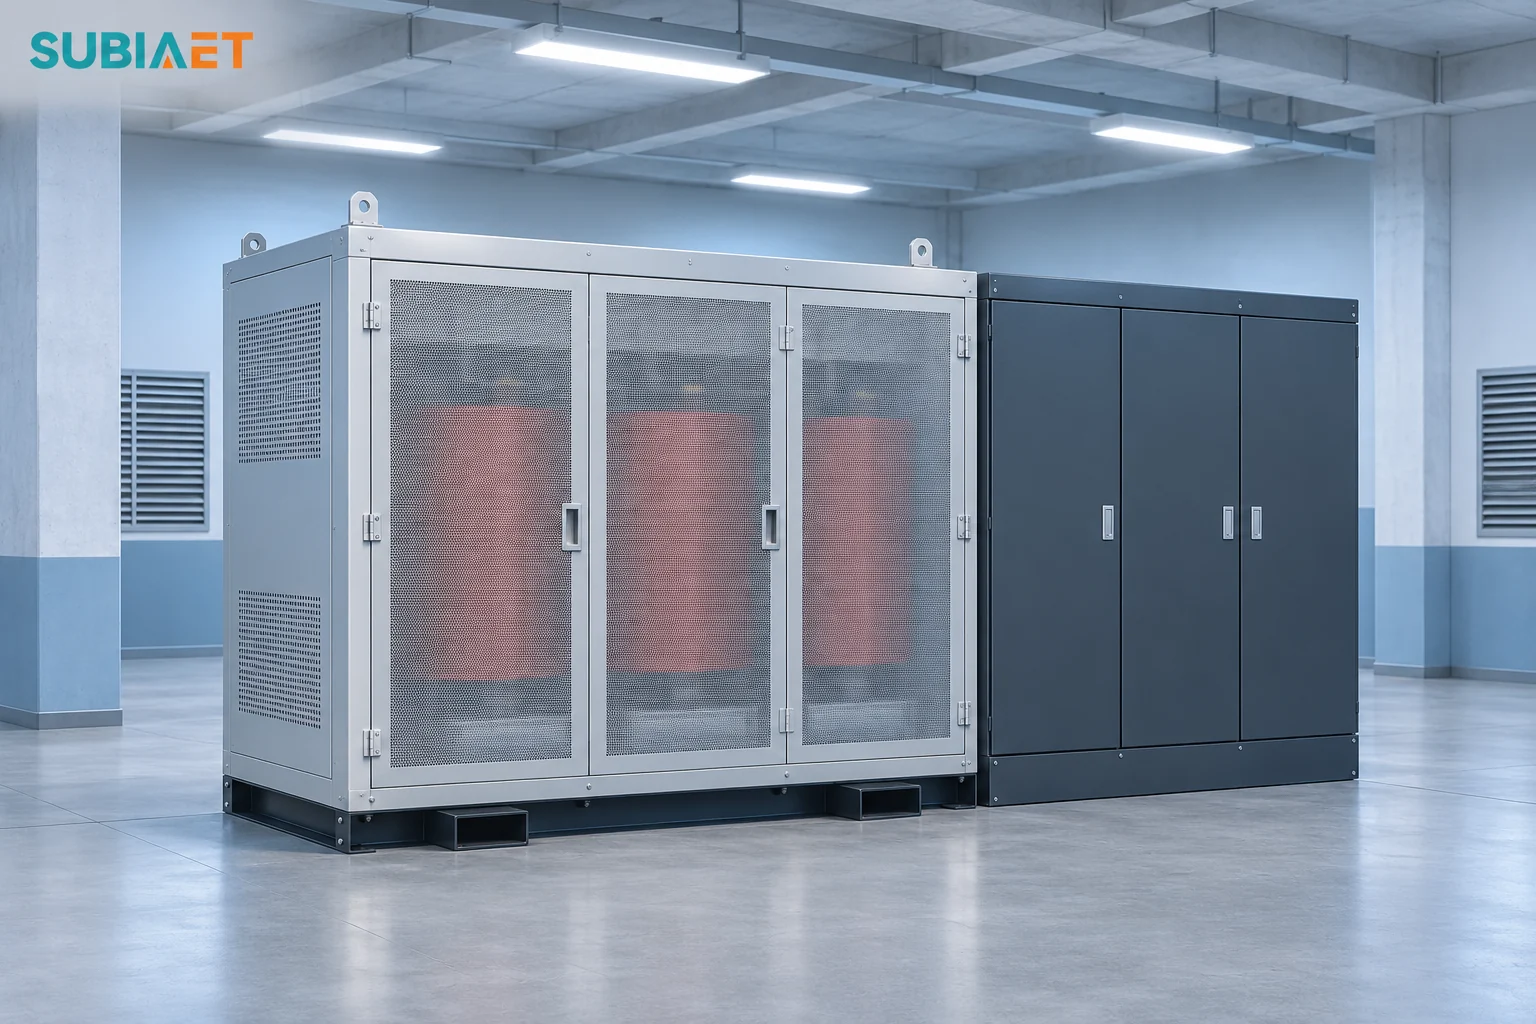
A data center transformer carries whatever its low-voltage boundary has to deliver in a specific operating state. It supplies the IT load through the UPS and may also supply rectifier and bypass feeds, battery recharge, cooling plant demand, and the auxiliaries that sit on the same board. Those quantities have different power factors and different coincidence. Sizing from the IT kilowatt figure alone can leave the transformer duty unverified in a real contingency.
The working method is to start from the approved one-line, convert the UPS output load into rectifier input at the matching operating point, distinguish recharge and bypass, and map cooling and auxiliary demand onto the path that actually carries it. Compare nameplates only after defining the loads that can coincide on each path, including the surviving path, and checking current, thermal and protection duty.
Start with the apparent power and RMS current at the transformer’s own terminals. Upstream and downstream meters and schedules may cover different equipment, voltage levels and periods. Put their readings on the same electrical and time basis before comparing them.
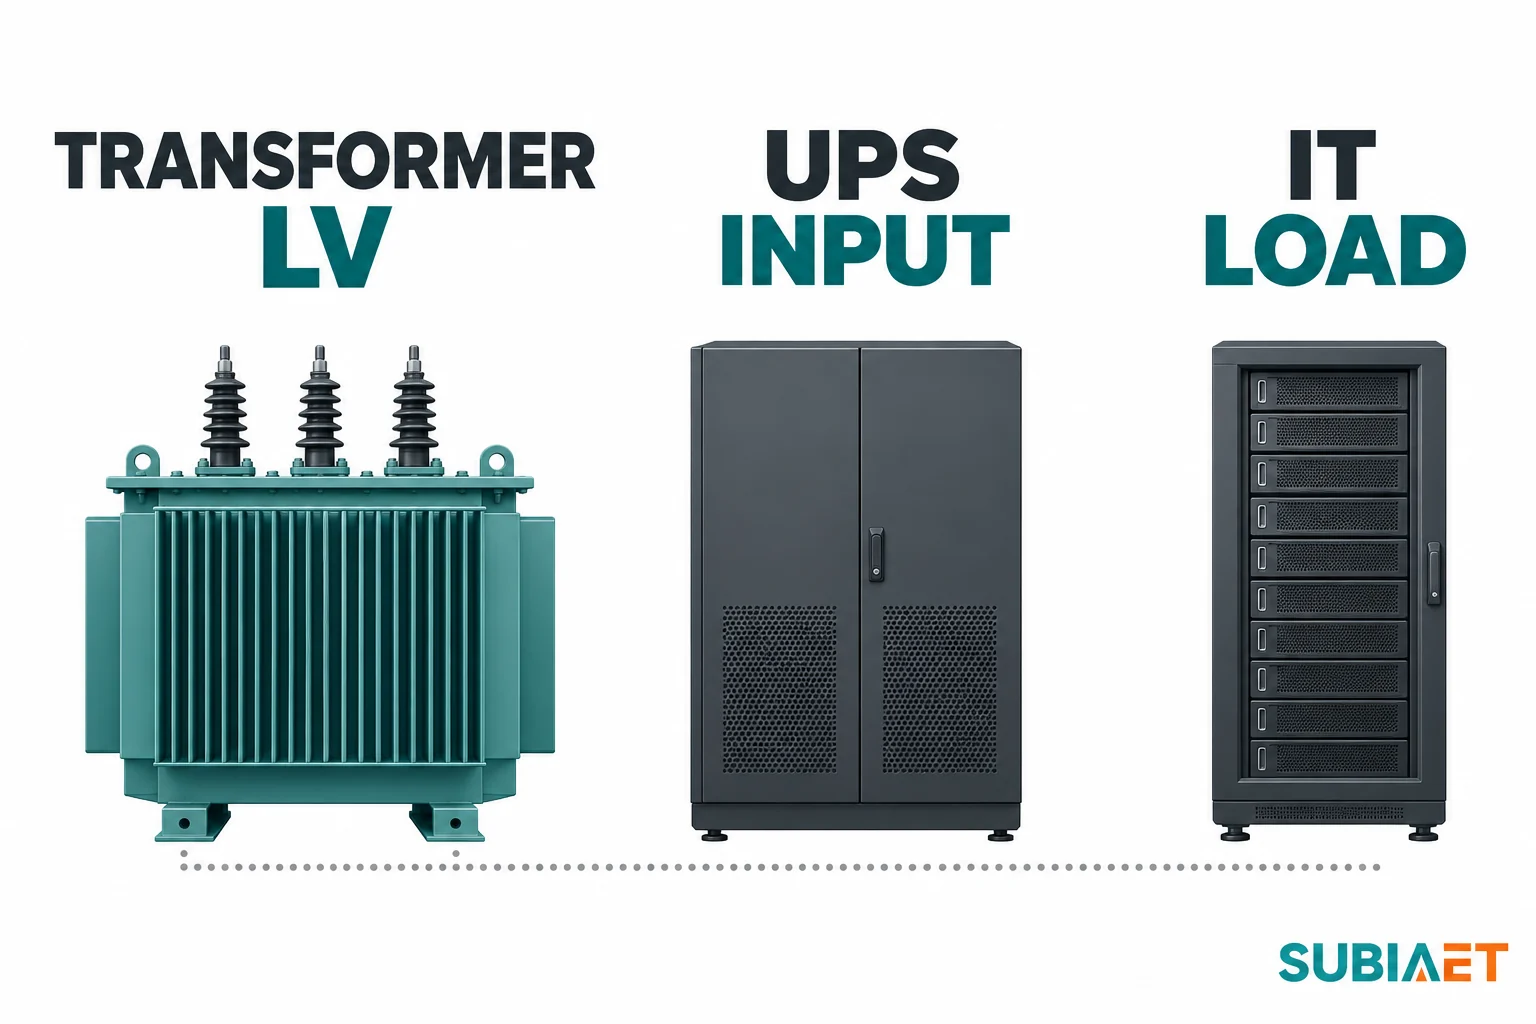
Take a typical chain. The utility service enters medium-voltage switchgear, feeds a transformer, and the transformer’s low-voltage winding lands on a main board. One feeder runs to the UPS rectifier. The UPS bypass may use the same supply or have a separate feeder and source. The UPS output feeds power distribution units and then the IT load. Chillers, condenser fans, pumps and air handlers may be on the main board, a dedicated cooling board supplied by the same transformer or an independent service. Some small cooling auxiliaries can be on the UPS output and belong in that output load once.
Four distinct measurement boundaries come out of that chain:
| Boundary | What it measures | Typical data source | What it is not |
|---|---|---|---|
| IT load kW | Power consumed by servers and network gear | DCIM, branch circuit monitoring, nameplate schedule | Not the UPS input |
| UPS output kW/kVA | Power delivered at the UPS output terminals | UPS display, output meter, design load list | Not the transformer load |
| UPS input kVA/A | Apparent power drawn by the rectifier | Input meter, RMS amperes per phase, manufacturer envelope | Not equal to output kVA |
| Transformer LV kVA | Coincident apparent power delivered at the transformer terminals | Transformer LV meter, or an assessed load schedule by feeder and state | Includes applicable UPS and direct feeders |
The difference between the IT load and the transformer can include downstream distribution and PDU losses, UPS conversion losses, battery charging, and the cooling and auxiliary loads sharing the board. Input and output power factors relate real to apparent power at their respective terminals. Add loads and losses at the boundary where they appear, counting each once.
The second thing to trace is independence, because a UPS with two input terminals is not a UPS with two independent sources. One vendor’s documented input-feed option makes the distinction concrete: the dual-input configuration requires two separate feeds at the UPS, while the single-input configuration uses a factory jumper so that one source supplies both the rectifier and the bypass input (Eaton Bid Manager, UPS Input Feed). Two lugs at the UPS therefore tell you about wiring, not about whether two separately available transformers or two utility services exist. That question is answered only on the project one-line.
Build the load list with the path written into every row. An IT row needs device identity, kW, supply cord or feed, and whether the figure is measured or scheduled. A cooling row needs equipment identity, running kW and RMS current or kVA, starting current and duration where relevant, and its board and upstream transformer. Record the measurement or design interval and the load state so you can sort the list by transformer.
Use measured data where it exists and scheduled data where it does not, but label which is which. A monitored peak from the building management system and a design-stage equipment schedule carry different assumptions and confidence, and mixing them silently in one column obscures the basis. Time matters as much as magnitude. The IT peak and the cooling peak may occur in different months, and the transformer’s governing case may be the coincidence of a load transfer with a cooling restart rather than the annual maximum of either.
In normal double conversion, rectifier real power covers UPS output and conversion losses, plus any concurrent charging or separately measured auxiliaries supplied through that same input. Divide real input power by the true input power factor for the matching case. If the measured or specified input already includes those loads, use that input directly.
The screen formula is:
kVA at rectifier input ≈ P_out ÷ η ÷ PF_in
Here P_out is the UPS output real power in kW, η is the AC-to-AC efficiency at the same voltage, load and mode, and PF_in is the true input power factor at those input terminals. This form screens the conversion path without separately counted recharge or auxiliaries. Use their confirmed coincident AC draw once where it falls outside the declared efficiency or current basis.
Prefer the OEM’s applicable input kVA or actual RMS input current and terminal voltage at the specified state. For balanced three-phase loading, kVA ≈ √3 × line-to-line RMS voltage × RMS line current ÷ 1,000, with volts and amperes. Check each phase directly when loads are unbalanced. With distortion, use true power factor, RMS values and the equipment’s spectrum as applicable. A calculation reconstructed from an efficiency table inherits the conditions in that table.
Consider the published data for a 500 kW unit at 400 V. The input column lists a nominal input current of 746 A, a maximum input current and input current limitation of 931 A, a nominal bypass current of 729 A and a nominal output current of 722 A. Input power factor is specified as above 0.99 at loads greater than 25% (Galaxy VXL technical specifications, 990-55333).
Those four currents describe different specifications on the same equipment. The 722 A figure is nominal output current, and the 746 A figure is nominal input current. The 729 A bypass figure is yet another path with its own basis. Use the rectifier input, rather than the output current, for a transformer serving that rectifier. Obtain the recharge basis separately. These independently stated current rows do not explain how the numerical differences were calculated.
Treat the listed 931 A maximum input and input current limit as equipment figures on a stated basis. The specification table does not pair that number with any one efficiency, exact power factor or DC charging row. Request the manufacturer’s basis for the limit, the modes and voltages in which it applies, and the simultaneous charger AC burden included in it.
Efficiency must be taken from the same mode, voltage and load level as the case being screened. For the same 500 kW unit at 400 V, published normal-operation efficiency is 97.2% at full load and 97.4% at half load, while at full load ECO is 99.6%, eConversion is 99.4% and battery operation is 96.1% (efficiency tables, 990-55333). Applying the ECO number to a transformer feeding the UPS in double conversion would understate estimated real input on the same output basis, and the error would propagate into any contingency using that estimate. Battery-operation efficiency describes supply from DC. Obtain AC recharge demand separately.
Two power factors are in play and they belong to different equipment. The input power factor describes the rectifier as a load on the transformer, and for this family it is stated as above 0.99 above 25% load. The output load power factor describes the IT or other equipment at the UPS output. Use rectifier input PF for the normal conversion case. In a bypass case, use the actual true PF or current of the connected loads at the relevant bypass supply boundary. The two power factors can differ.
Three other checks affect the current or determine which cases can occur:
For background on why apparent power, real power and power factor move independently in transformer selection, see transformers rated in kVA: kW, kVA and power factor.
These operating states can put different loads on different transformers. Use the one-line and the permitted sequence to determine which demands can occur together.
Rectifier supplying the load. When recharge is inactive, use the applicable UPS AC input. In a calculation, account for output and conversion losses and any float-charge or auxiliary draw excluded from that basis.
Rectifier supplying the load and recharging the battery. After a discharge, recharging can add AC input while the UPS also supplies the load. For the named 500 kW unit, the 400 V battery data list a maximum charge of 100 kW at full output load and 200 kW at zero output load, on a VRLA basis. Those figures are from the battery section at different operating points. The 200 kW figure cannot be added to a full-load output or treated as the same AC draw at the rectifier. The input stage has a stated current limit. Build a recharge case from the offered equipment’s documented AC burden, limits and control behavior, including overlap and duration, rather than from the largest number in the table.
Bypass. The load is transferred to the bypass source. The rectifier may continue running, may be commanded off, or may be drawing recharge current, depending on the mode. Requested static bypass, forced static bypass and an external maintenance bypass through its own disconnect path are described as distinct states on this model, and the manual specifies different battery fallback availability for requested versus forced or external maintenance bypass. Parallel-module static bypass standby is described separately and is conditional on remaining module support (Galaxy VXL operation, 990-55222).
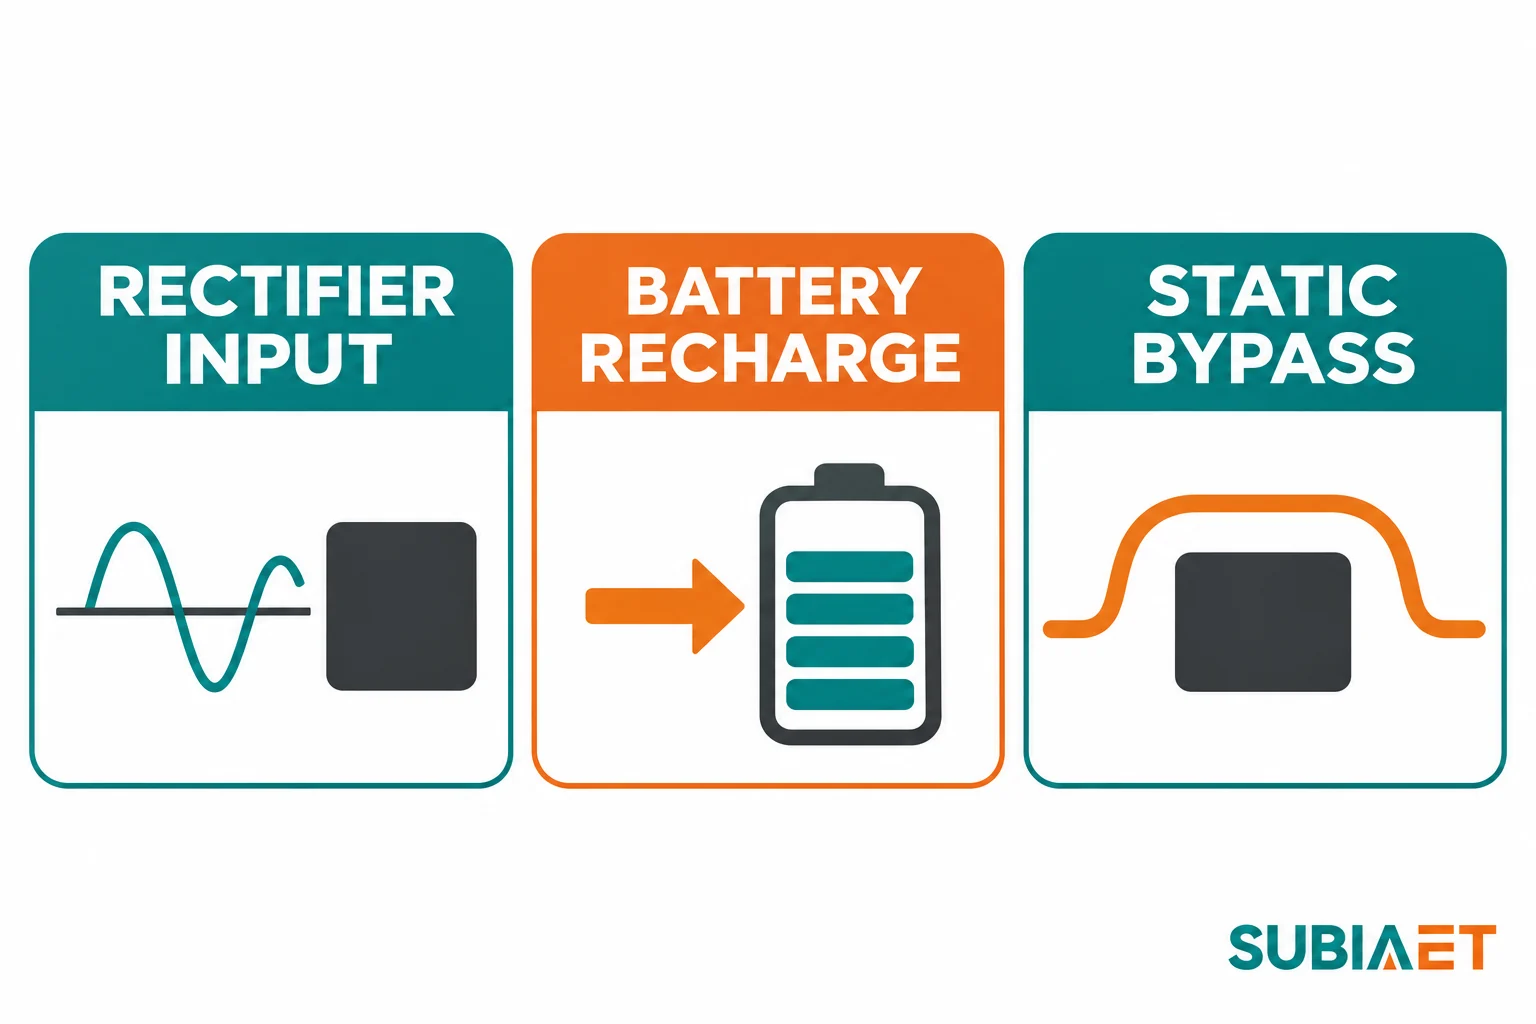
The practical consequence is that a bypass case and a rectifier case can use different arithmetic and can load different transformers. For the bypassed load use the true load power factor on the applicable supply basis:
kVA in bypass ≈ P_load ÷ PF_load
The bypass path avoids the main double-conversion losses, but its power factor can differ from the rectifier input power factor. In the example below, an 800 kW bypass load at 0.94 true PF is about 851 kVA, compared with about 842 kVA for the 800 kW conversion case at 0.96 efficiency and 0.99 input PF. The bypass case has the higher UPS-side apparent-power screen in this example. Include any separate loads or losses that actually lie on the bypass supply.
The second consequence is double counting. If the rectifier remains energized or charges while the load is on static bypass, the rectifier and bypass feeds each carry their actual share of the demand, and one common transformer may supply both. Count the supported load once. Scope each number by feeder, state, charger status and duration. A short transfer for a test and a sustained bypass state during a repair are different design cases. A short interval may affect voltage response or protection, and thermal assessment depends on the current, duration, repetition and prior temperature.
Maintenance bypass deserves its own line in the schedule because it can be physically separate. An external maintenance bypass routes the load around the UPS through its own disconnect path. When that path is in use, the UPS may be fully isolated and the rectifier may draw nothing at all, while the transformer feeding the maintenance bypass carries the supported load. Confirm whether that transformer also feeds the cooling plant and which transfers are permitted. The equipment supplier and electrical designer can establish the supported routes, and the operations lead confirms the approved procedure and duration.
Finally, separate the battery-only interval from the restoration. During a battery-only supply interval, there is no AC rectifier draw for the supported UPS output. Other loads can remain on the transformer for the duration of the ride-through, according to the one-line and source availability. The governing case may arrive afterwards, if the load returns and the charger simultaneously works to restore the battery. Check the permitted timing, any auxiliary loads, and the state from which the transformer starts recovery.
Cooling can be one of the largest non-IT loads on a data center transformer. Establish its actual equipment loads and supply paths before comparing transformer ratings.
Start with the physical distinction that the DOE Federal Energy Management Program guide makes explicitly. Cooling electrical power in kW and cooling load in tons describe different quantities. Section 8.7 of the guide separates the two, and the cooling plant discussion shows how different compressors, fans, pumps and economizer states can carry different electrical demand (DOE FEMP Best Practices Guide for Energy-Efficient Data Center Design). Tons describe heat removed. Use the electrical input, including current or kVA at the applicable state, to assess transformer duty.
A cooling electrical schedule for transformer sizing should carry, per item:
The plant can use different combinations of equipment across states. A chiller plant in free-cooling mode can run pumps and fans while reducing or avoiding compressor operation, depending on how much load the economizer serves. A plant at design wet-bulb has its own operating equipment and staging schedule. Sizing on the highest credible coincident state is legitimate if it genuinely can occur. Check which combinations of IT demand, cooling stage and transfer or restart can coincide on each path.
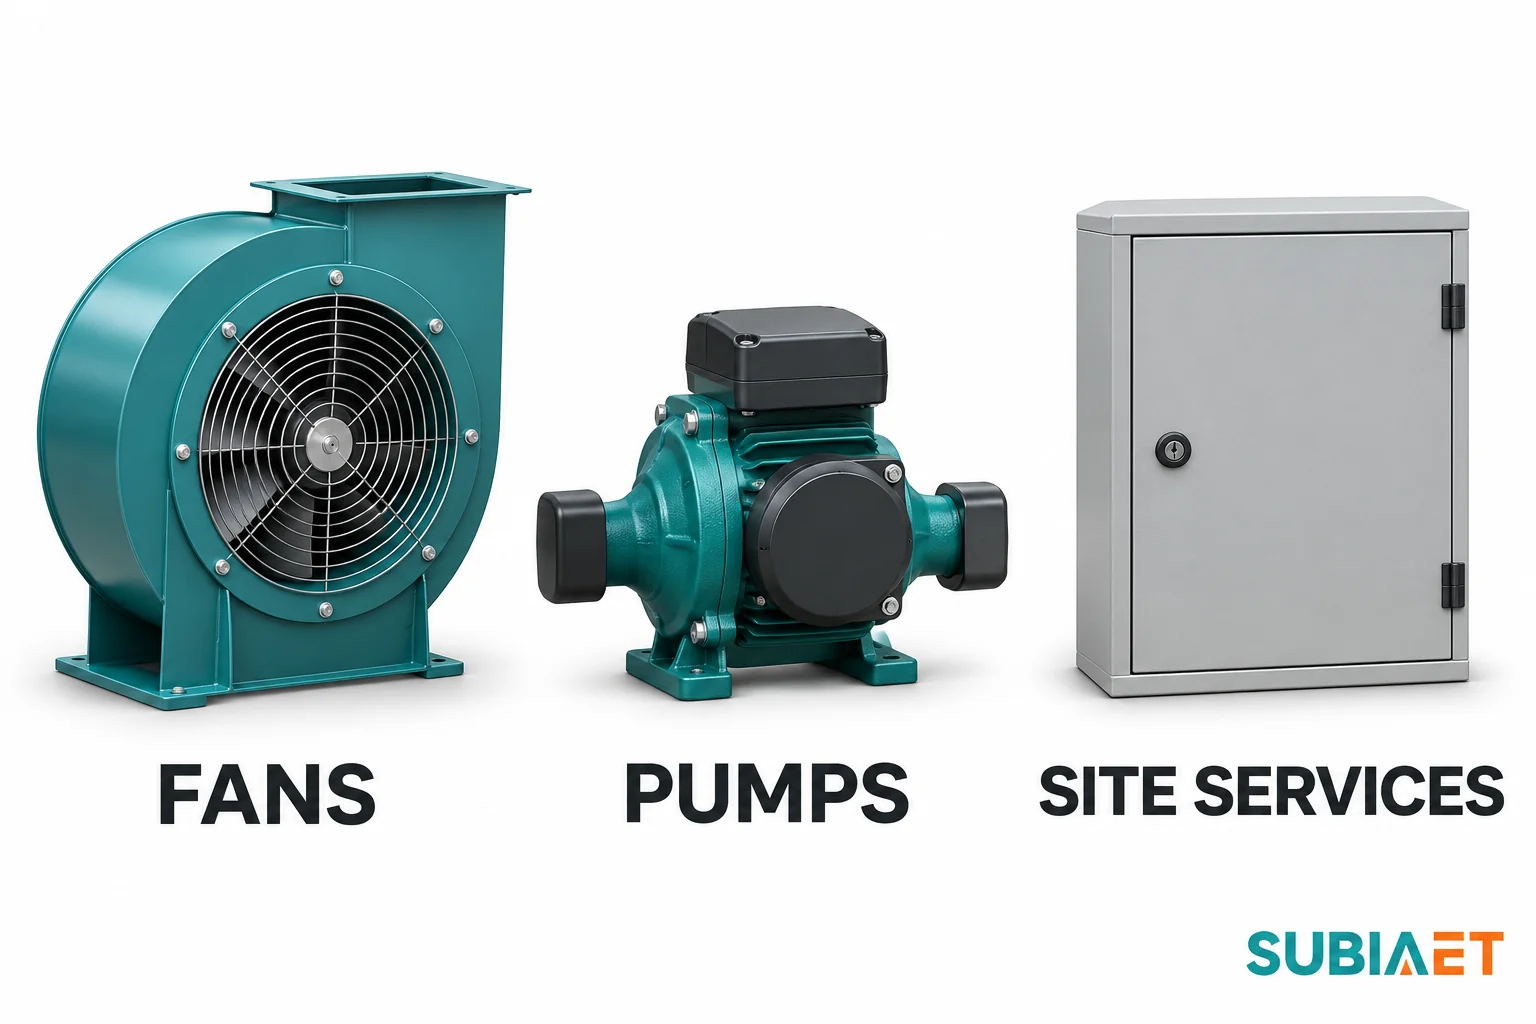
Transformer room ventilation or cooling, UPS room cooling, lighting, controls, fire and life safety systems, security, sump pumps, and any building services sharing the board all contribute to the LV boundary. Transformer and UPS losses release heat, some of which may have to be removed by the equipment-room cooling system. Track electrical input and heat rejection separately. Transformer losses are upstream of the transformer LV delivered-power measurement, while room fans or pumps supplied from that LV board are downstream electrical loads.
Map each item to the path that carries it in each state. Three common arrangements behave very differently:
Cooling dedicated to a path. Each transformer feeds its own chillers and pumps in this arrangement. Losing one path can take its connected cooling equipment with it. Verify whether the surviving plant can serve the whole hall, what cooling stays available during transfer, and how the surviving transformer’s electrical loading changes if the remaining equipment is asked to do more.
Cooling on a common board with a tie. Two transformer feeds may reach sections of a cooling board that can be joined through a tie. Check which sections are energized in normal operation and which tie positions are permitted. In an approved contingency, one transformer may carry additional plant loads if the sequence and capacity allow it. Its running and restart demands can then govern the surviving-path calculation.
Cooling on a separate service. If the cooling plant has its own utility transformer and stays on that supply in the case considered, its electrical load stays off the IT transformer. Any room or rack auxiliaries on the IT path still belong in its schedule, and the cooling transformer needs the same analysis in its own right.
Section 8.1 of the DOE guide defines PUE as total annual facility energy divided by annual IT energy, which makes it useful as a bounded energy metric. It helps compare energy use over a consistent period and measurement boundary. Multiplying IT kW by annual PUE cannot give transformer kVA. Cooling and IT peaks may occur at different times, and the energy ratio does not identify the power factor or which path carries which load after a transfer. Use coincident demand and electrical paths for design apparent power.
Define the scope of the redundancy architecture before estimating how much current the transformer carries after a loss.
Keep the terms concrete. N is the capacity required to carry the load. N+1 means one additional component beyond that requirement. 2N means two fully rated paths, each capable of carrying the full load, within whatever boundaries the design actually draws. None of these terms automatically describes the transformer, the cooling plant, or the utility service.
The distinction matters because the components can be redundant at one level and common at another. A parallel-redundant UPS bus with N+1 modules adds module redundancy on a common load bus while retaining a common failure point, the bus itself (Schneider Electric White Paper 75, Comparing UPS System Design Configurations). A site can have N+1 UPS modules and a single transformer, in which case that transformer is a common point. Conversely, a transformer can be duplicated while the cooling plant is not. Trace the shared upstream and downstream equipment.
System-plus-system arrangements declare two paths, with loads that have two separate supplies and single-cord loads using an appropriate transfer arrangement. At the agreed scope, a surviving path has to carry the loads assigned or transferred to it. ASHRAE’s data center chapter distinguishes duplicate UPS or dual-cord distribution from site-wide electrical and cooling redundancy. It also discusses maintaining critical cooling through an electrical interruption, where cooling load and compressor starts affect whether support can be sustained (2023 ASHRAE Handbook — HVAC Applications, Chapter 20).
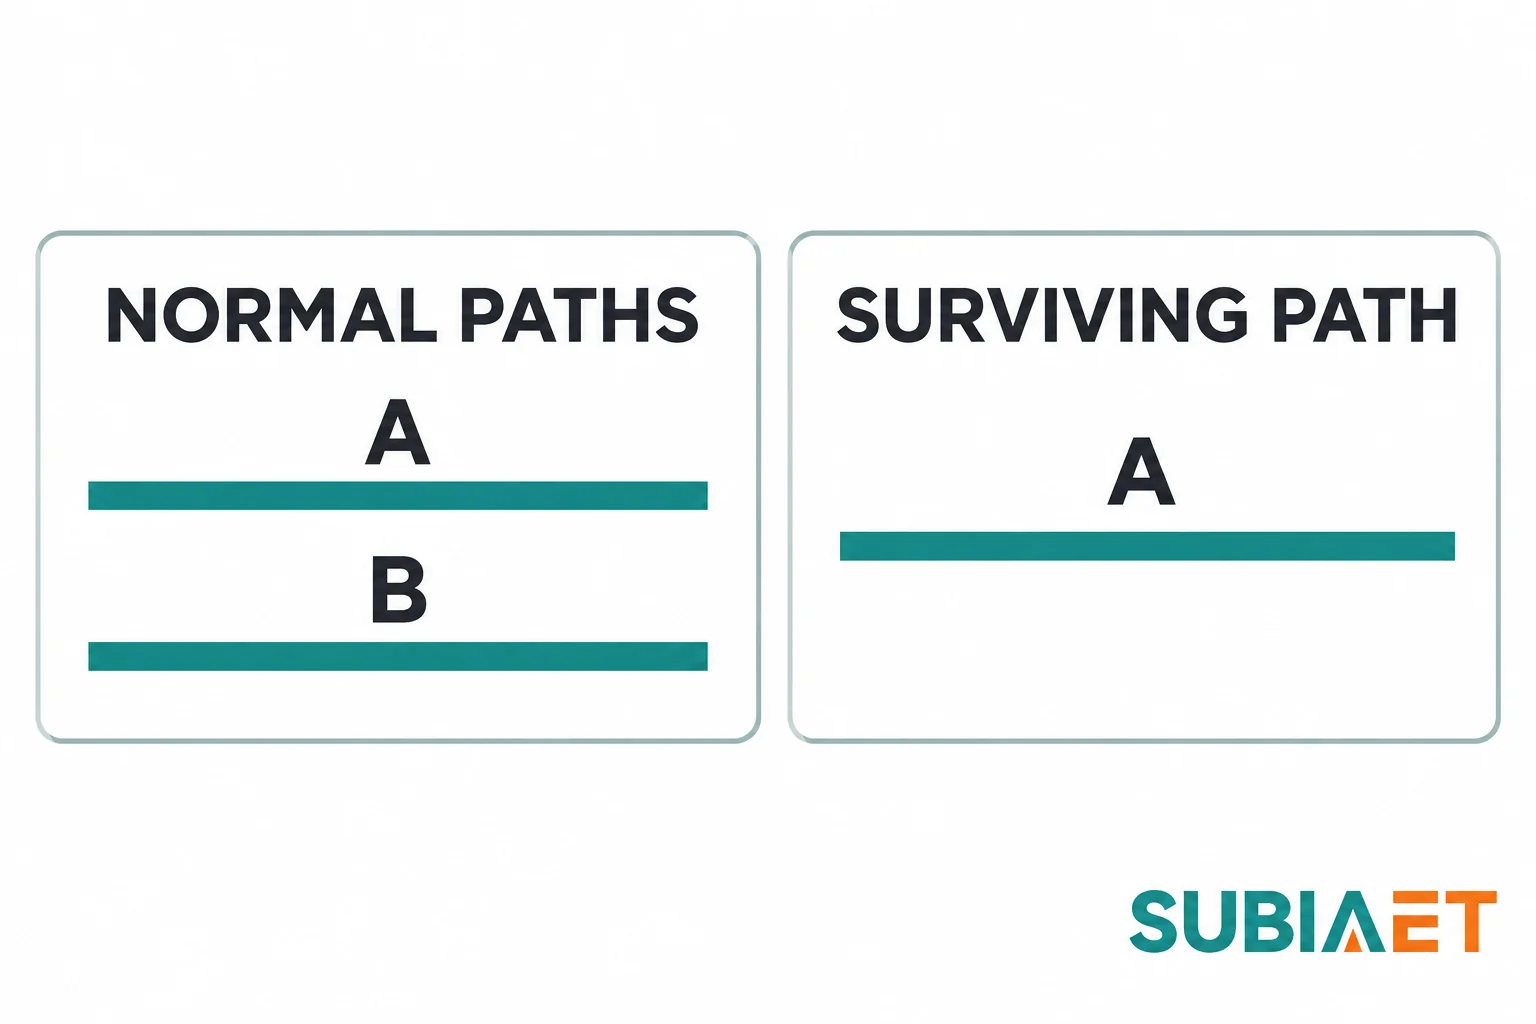
Test the schedule against each of these states separately rather than inventing one composite worst case:
Two verification points help establish whether the surviving-path number is real. First, dual cords. If both cords of a dual-corded server are energized in normal operation, the supplies may share current, and the split is not necessarily even. When one path is lost, a server designed to continue on one cord can shift its full input to the surviving cord. Verify the actual power-supply mode and what the feeder must carry. Second, cooling common points. If both paths feed one cooling board through a tie, check which cooling loads the survivor is allowed to carry. Plant restart current can coincide with the transferred IT load, depending on the controls and sequencing.
Avoid defining the backup case as the sum of unrelated maxima. The August cooling peak, December IT peak, post-outage recharge peak and planned maintenance state can be different scenarios. Determine which combinations the equipment and operating plan can produce. Include those overlaps in the load schedule and keep unrelated maxima separate.
A kVA screen produces a shortlist, not an approval. Between the screen and the purchase order sit six checks that can each change the answer.
Voltage and current. Confirm the actual service voltage, the tap range, and the current at the low-line condition. Convert a balanced kVA screen to amperes at the actual voltage. Check per-phase current rather than assuming balance, especially with single-phase loads, uneven branch loading or a transformer bank configuration that creates unequal winding loading.
Waveform and neutral. Rectifier, drive and switch-mode power supply loads can draw non-sinusoidal current. Harmonic currents contribute to total RMS current, can increase winding eddy losses, and can load a neutral where there is a path for triplen harmonics. The transformer enquiry should state the harmonic spectrum at the relevant operating states and ask the supplier for the offered unit’s thermal or derating assessment. A single THDi value does not describe the spectrum. On harmonic duty and when a special design is warranted, see transformer harmonics: when to review derating or a special design.
Thermal duty and duration. Transformers have thermal mass, so a short overload and a sustained overload are different events. The governing questions include how much current, for how long, and from what prior temperature. A surviving path that carries full load during a short maintenance interval and a path that serves as an alternate supply during an extended outage both need a permissible loading basis. Request the applicable temperature-rise limit, cooling stage and load-versus-duration data for the specific unit, together with ambient and prior load assumptions. A short duration by itself establishes no overload allowance.
Cooling, enclosure and ambient. Dry-type and liquid-immersed units have different cooling classes and different responses to enclosure and ambient temperature. Check the conditions for each cooling stage on the offered nameplate, including the actual room, enclosure and ventilation. Altitude, dust and ventilation can affect usable capacity, depending on the equipment and installation. This is also where the transformer’s heat loss can re-enter the mechanical cooling schedule.
Protection, inrush and fault duty. Energizing a transformer can draw a transient inrush current. The upstream protection has to accommodate the applicable energization cases while detecting and clearing faults. Asking for a different nameplate can change transformer impedance in ohms, inrush and available fault current at the low-voltage board, which may change the results of the existing coordination study. Verify with the actual transformer and source data. For the coordination questions to settle before ordering, see transformer inrush current: what to confirm before protection coordination.
Source characteristics. A utility supply and a generator can have different voltage regulation, available fault current and step-loading capability. A step load applied by a chiller restart or a UPS transfer can produce a voltage dip. Check how the specified source, transformer and UPS respond together, including whether the UPS accepts the source at that operating point. Site and generator constraints belong in the transformer review.
Keep three kinds of evidence distinct. A utilization estimate is a planning figure produced by the screen. Factory evidence includes unit-specific routine tests and applicable type or design evidence with its own scope. A nameplate rating identifies the offered duty under declared conditions. Confirm separately the actual installation, permissible loading and utility or owner limits. Choose any planning margin for this project’s uncertainty, growth, coincidence, duration, harmonic content and ambient.
The following comparison is a planning screen. It uses stipulated nameplate, efficiency, power factor and path-duty assumptions to demonstrate the arithmetic and the case boundaries, and nothing in it establishes that any upstream topology, utility arrangement or transfer sequence is acceptable.
Fictional transformer loading screen only. Equipment nameplates, efficiencies, power factors and path duties are assumptions for this case.
One balanced three-phase data center has two modeled transformer paths A and B. Supported IT load at the UPS output totals 800 kW, normally split 400 kW on each path. The approved example allows one path to carry all 800 kW after an explicitly modeled transfer. Conversion-mode efficiency is 0.96 excluding battery recharge, and rectifier true input PF is 0.99 for the stated normal and recovery cases. The stipulated auxiliary apparent loads are on the same transformer LV boundary in each row. The arithmetic sum of coincident kVA magnitudes is a conservative planning screen, rounded to the nearest kVA.
| Case | UPS-side basis | Conversion or bypass arithmetic | Coincident auxiliary kVA | Resulting transformer LV screen |
|---|---|---|---|---|
| Normal on each path | 400 kW UPS output, no recharge | 400 ÷ 0.96 ÷ 0.99 ≈ 421 kVA | 160 kVA cooling + 40 kVA other | 621 kVA on each path |
| One path carries the full load | 800 kW UPS output, no recharge | 800 ÷ 0.96 ÷ 0.99 ≈ 842 kVA | 230 kVA cooling + 65 kVA other | 1,137 kVA on the surviving path |
| Static bypass on surviving path | 800 kW at load true PF 0.94; this case has no simultaneous rectifier or recharge draw from this path | 800 ÷ 0.94 ≈ 851 kVA | 230 kVA cooling + 65 kVA other | 1,146 kVA on the bypass-supplying path |
| Surviving path with recovery charge | 800 kW UPS output + 120 kW additional charger AC input at the stated combined PF | (800 ÷ 0.96 + 120) ÷ 0.99 ≈ 963 kVA | 230 kVA cooling + 65 kVA other | 1,258 kVA during this modeled recovery case |
| 1,250 kVA candidate | Compare to stated path cases | Same LV basis | No allowance claimed | Below the modeled 1,258 kVA recovery screen |
| 1,500 kVA candidate | Compare to stated path cases | Same LV basis | No allowance claimed | Clears arithmetic only. Confirm actual operating controls, current, thermal and fault duty before approval. |
Reading the table in order:
The normal case is the least demanding of the illustrated states. Each transformer carries 621 kVA in this case, which is roughly half of the smaller candidate’s nameplate. This state also matters to a lifetime cost review if it represents enough operating hours. Use the actual energized hours, load history or forecast, and supplier no-load and load losses for that comparison.
The single-path case raises the surviving transformer to 1,137 kVA. Two changes coincide in this modeled state. UPS output doubles under the stipulated transfer, and the coincident cooling and other loads on the surviving LV boundary increase to the quantities listed in the table. Both are case inputs tied to a specific path.
The static bypass case gives 1,146 kVA, 9 kVA above the single-path rectifier case after rounding. The main conversion losses are avoided, but the assumed load power factor is 0.94 compared with 0.99 for the rectifier input. In this case the PF effect is larger. Different load power factors, bypass feeder losses or auxiliary allocations can change the ordering. Calculate each state on its actual path.
The recovery case is the highest modeled screen at 1,258 kVA. First convert the 800 kW UPS output to AC input by dividing by 0.96. Add 120 kW of additional charger AC input once, then divide by the stated combined true input PF of 0.99. Add the 295 kVA of coincident auxiliary magnitudes. The table assumes this overlap is permitted in the recovery case.
Against that screen, the 1,250 kVA candidate is 8 kVA below the rounded modeled recovery case. This flags the case for a documented review of actual current, permissible duration, thermal conditions, voltage and operating limits. The real recharge profile and the charger’s programmed limit affect the result. A charger that ramps more slowly, or an approved control scheme that defers recharge until cooling restart is complete, can change the overlap if the vendor and operations team document it.
The 1,500 kVA candidate clears the arithmetic. It is a candidate, not a selection. It still has to be checked against per-phase current at the actual terminal voltage, thermal duty for the duration the contingency is expected to last, harmonic content from the equipment on the applicable path, inrush and coordination with the upstream device, and fault level at the low-voltage board. A different candidate can change the available fault current depending on actual transformer impedance and source conditions. Check the board and protection with the candidate data.
The table assumes the transfer, load allocation and recovery conditions for illustration. Actual acceptance requires the approved one-line and operating sequence, including the separately available sources, transfer permissions and cooling continuity under the project’s required states.
To compare lifetime costs for the two nameplates, use their offered no-load and load losses on the actual energized and loaded profiles. See transformer losses and total cost of ownership: comparing two quotations.
Every number in the screen traces back to a document that someone has to produce. Assign the request to the role that owns the answer, and state what the document has to contain.
| Role | Evidence to request | What it closes |
|---|---|---|
| UPS vendor | One-line of the offered configuration; mode table with rectifier, recharge, requested and forced static bypass, maintenance bypass and applicable standby; input current envelope at the specified voltage, mode and load; recharge AC demand profile and programmed limit; bypass source voltage and frequency, supported loading, transfer permissives and accepted overlap; input PF and harmonic data against load. | Rectifier and bypass kVA, recharge increment, transfer feasibility |
| Cooling designer | Electrical schedule per item with running kW and kVA, starting or drive input current and duration, economizer state, feed board and upstream transformer; restart sequence and staging timers; design ambient and its coincidence with the IT peak; CRAH and pump arrangement; identification of any common board with a tie. | Cooling kVA per path, restart duty, surviving-path cooling load |
| Electrical coordination designer | Protection coordination study for normal and required contingency states; fault levels at the available sources; transformer impedance and tap range; inrush and energization study; cable and termination ratings; applicable arc-flash assessment and low-voltage board capability against the modeled fault duty. | Current, transient and protection duty; effect of a different nameplate |
| Operations lead | Which transfers are approved and by whom; accepted duration of the single-path state; automatic versus manual transfer; expected recharge timing after an outage; maintenance bypass procedure and approval status; monitoring points, intervals and logging for the UPS input, board feeders and cooling plant. | Actual coincidence, duration and load data |
| Utility or owner | Applicable service capacity and permitted loading at the point of supply; historical demand data where available; contractual or tariff limits where relevant. Obtain standby source capacity, step-loading capability and voltage response from the owner and source designer. | Conditions for the actual service and recovery case |
| Transformer supplier | Offered nameplate; impedance and losses at stated load; temperature-rise and cooling basis; tapping range; assessment for the stated harmonic spectrum, ambient and altitude; sound, dimensions and weight where specified. Obtain the agreed unit routine records and applicable type-test or design evidence at the relevant acceptance stage. | Equipment limits and acceptance evidence behind the shortlist |
Distinguish document types when you receive them. A routine test report records the tested results for the individual unit that will ship. A type test report covers a representative design within the ratings and configurations in its documented scope. A quotation can establish a guarantee, and a test report establishes which results were measured. Check each required record’s scope and agreed acceptance stage.
Two questions are worth putting in writing before any nameplate is fixed:
Build the path-sorted load list first, then approach suppliers with the one-line attached. A transformer quotation returned against a bare kVA figure cannot be checked, because the supplier has no way to know which states the number represents.
For the wider application context, see data center and public infrastructure power. For the general sizing method when the topology is simpler than a dual-path data hall, see transformer sizing for factory expansion.
Use input RMS current or apparent power and the applicable auxiliary loads at the transformer’s own boundary. IT kW describes real load downstream of the UPS. The upstream duty can also include conversion losses, charge power and coincident cooling, with apparent power calculated using the applicable input power factor. For the published 500 kW unit at 400 V, nominal output current is 722 A and nominal input current is 746 A, illustrating why the two labels need separate treatment.
Redundancy has a declared scope. Two UPS paths can still share a transformer, bypass source, cooling board or other dependency. Trace both transformer supplies, check their path capacities and identify which electrical and cooling loads remain supported after the required loss or transfer. Use the approved one-line and operating sequence to establish that scope.
Recharge can set the screen when substantial UPS output, charger AC input and other path loads are allowed to overlap. In the worked example, the stipulated 120 kW additional AC input increases the single-path calculation from 1,137 kVA to 1,258 kVA. Confirm the offered charger limit, charging duration and actual recovery controls to establish whether that overlap is credible.
Use PUE to compare energy on a consistent basis. The annual PUE discussed in the DOE guide is total annual facility energy divided by annual IT energy. For transformer sizing, use the state-specific apparent power or current at the named boundary, including the cooling and auxiliary loads that can coincide.
A larger nameplate can reduce the modeled utilization percentage. Its actual losses, impedance and available fault current still depend on the offered design and the source. Compare those values using the same duty and loss basis, then verify current, thermal and protection performance for each required state.