Request a Quote
Share the equipment and project requirements. If you need help selecting a model, describe the application.
Have drawings or specifications? Email [email protected] with your project reference.

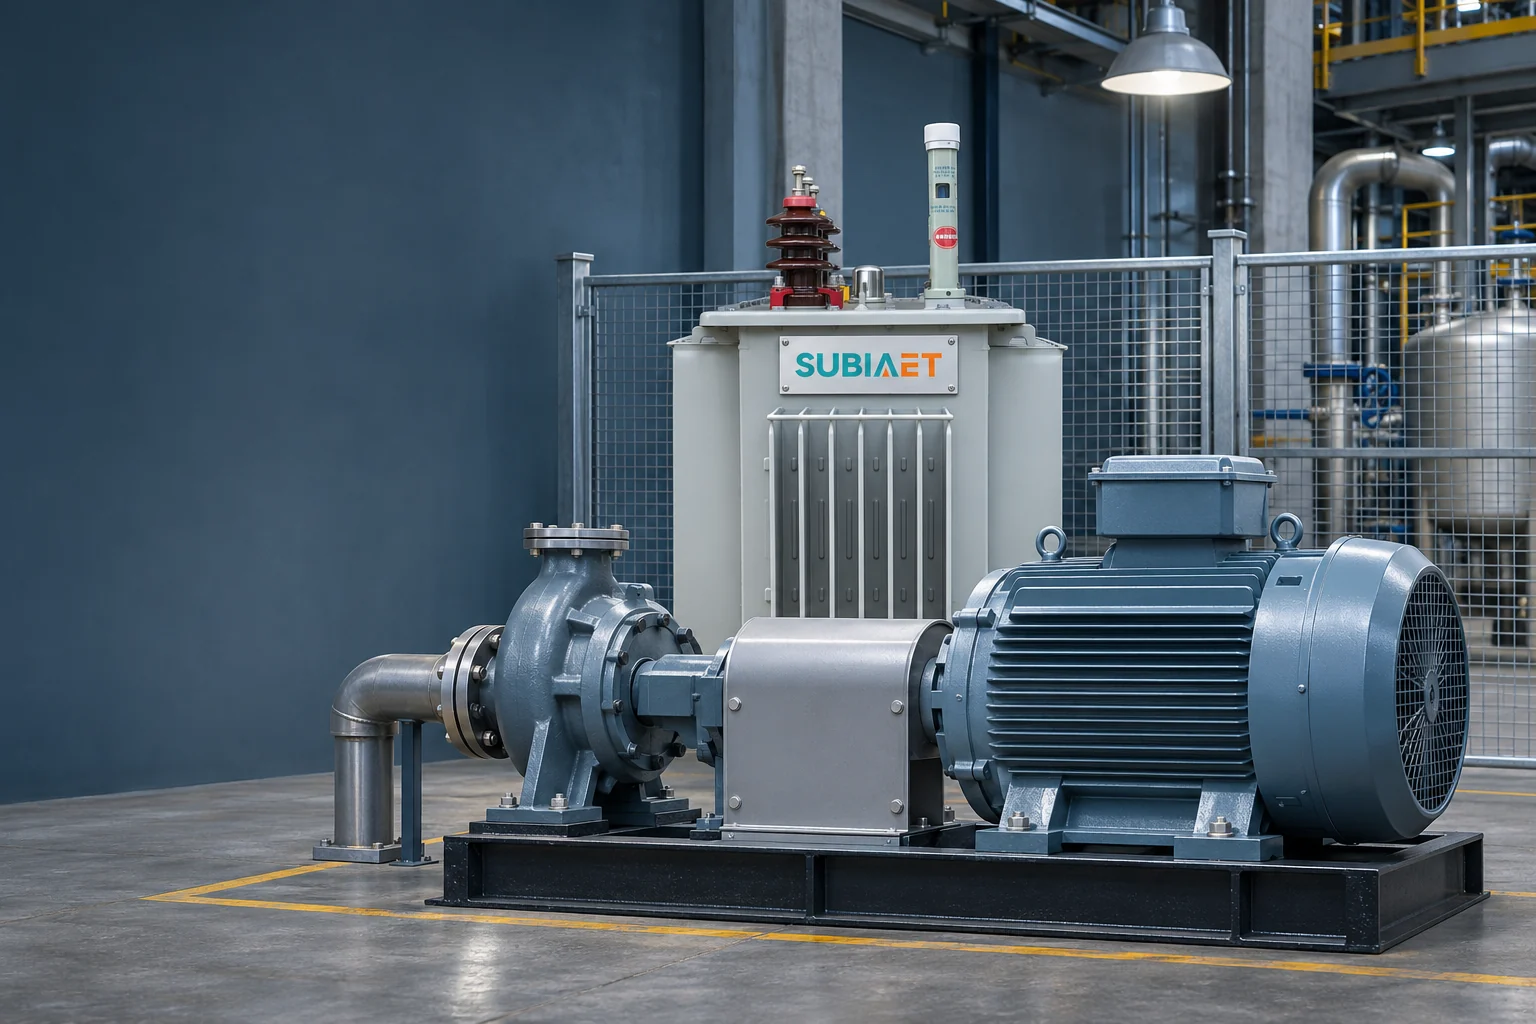
A transformer that carries a plant’s running load with room to spare can still be part of a supply that suffers a disruptive motor-start voltage dip. Running kVA and starting duty are different checks against different limits. A nameplate rating does not by itself establish the starting performance of the complete system.
Running capacity asks whether the transformer can carry the continuous load at the applicable temperature and cooling conditions. Starting duty asks whether enough voltage remains at the motor terminals long enough for the motor to develop torque above the driven load and reach operating speed — and what that dip does to other loads sharing the same bus. The starting assessment follows the actual event duration and needs supply impedances, motor and driven-load characteristics, and starting-method data.
The running check is a thermal and loading exercise. Establish simultaneous apparent demand in each credible operating scenario, include defined future loads once, and compare the duty with the transformer rating under the actual ambient and cooling conditions. It works with sustained load and duration rather than treating starting current as an unexplained kVA allowance. The factory expansion sizing example shows the running-load calculation.
The starting check is an event. It begins with the motor at standstill and follows acceleration toward operating speed. Current flows through the supply path and changes the voltage available to the motor and other loads. Its magnitude and duration depend on the motor, supply, starter and driven load. Prolonged or repeated starts also require thermal and protection checks; their heating contribution cannot simply be assumed negligible.
Four currents get confused in this conversation, and they should not be:
Treating these as interchangeable produces screens that mix unlike quantities: a first-cycle peak substituted into an RMS calculation does not preserve its basis, and a transformer-inrush figure applied to a motor feeder describes a different event.
Current is also not constant during the start. The locked-rotor value describes the stationary motor at its stated test voltage. As voltage and speed change, the current can change as well. Obtain current-versus-speed and torque-versus-speed information for the motor and starting method rather than treating one locked-rotor value as a complete time trace. The ABB low-voltage motor guide distinguishes starting RMS current from the switching peak and compares starting methods.
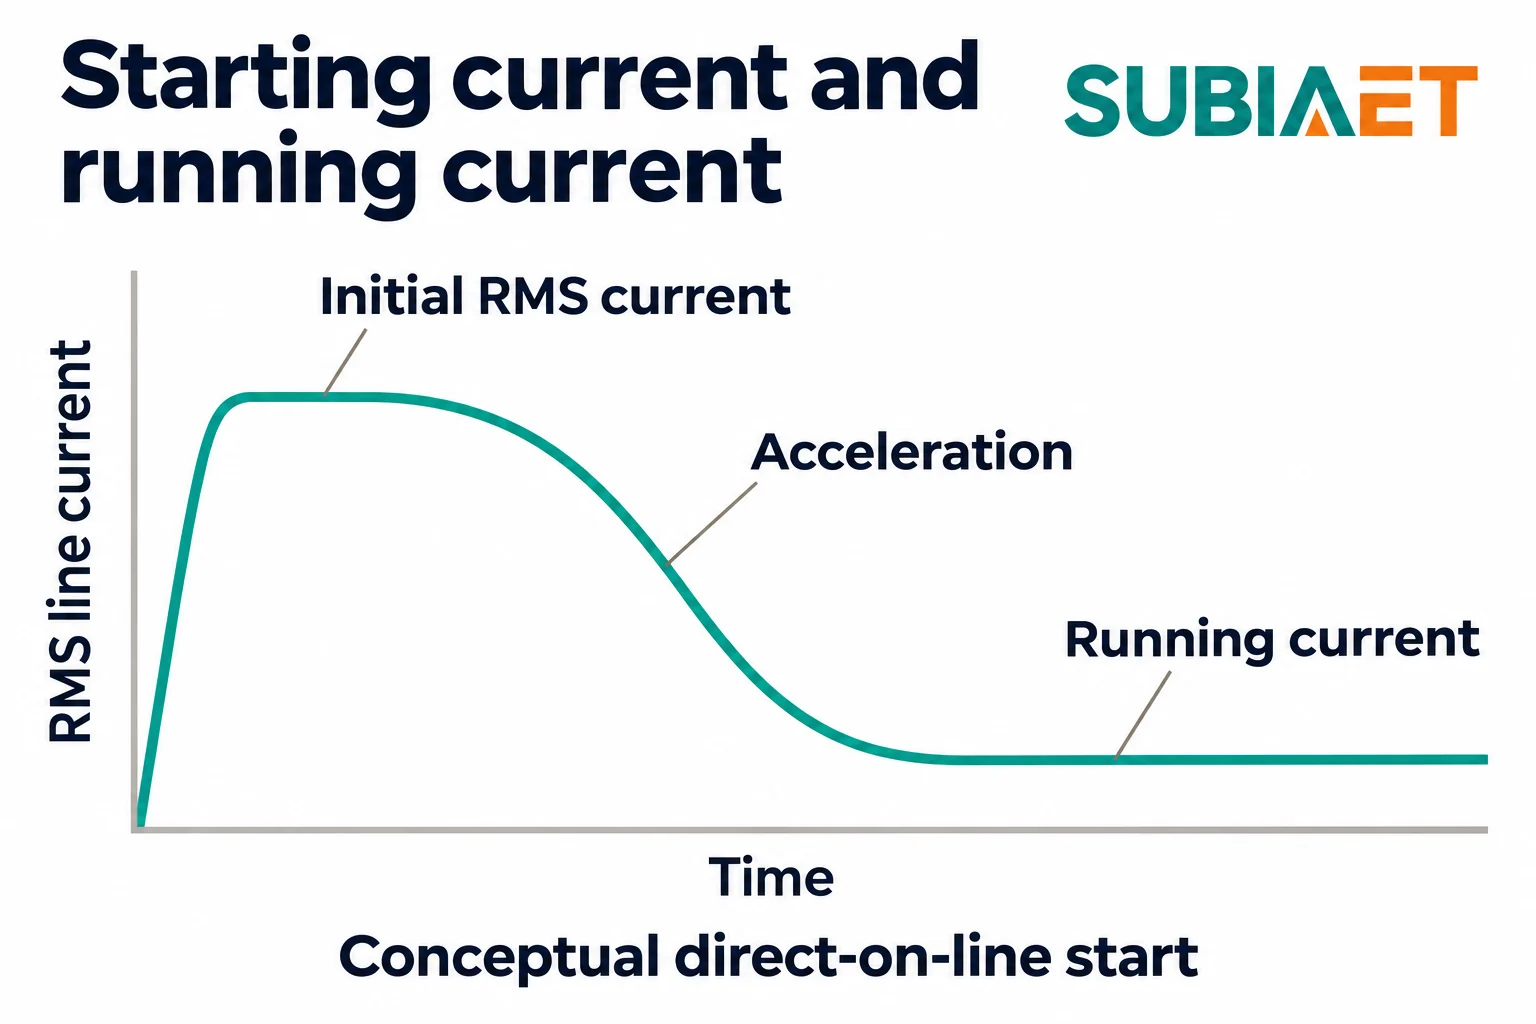
How long acceleration takes depends on the inertia being accelerated and the difference between available motor torque and driven-load torque at each speed. Available motor torque is itself affected by the supply and starter. A load demanding substantial torque from low speed needs a different assessment from one whose torque demand rises later in the speed range. Two motors of identical rating on the same supply can produce different dip durations because of what they are driving.
The starting method changes what the supply sees as well as what the motor produces:
For a drive, use the drive’s line-side input data at the actual load condition. For a soft starter, use the manufacturer’s input current data at the intended settings. For DOL, use the motor’s locked-rotor current at the stated voltage. Commonly quoted multiples of full-load current are a memory aid, not design data — the actual value varies with motor design, and the actual value is what the calculation needs.
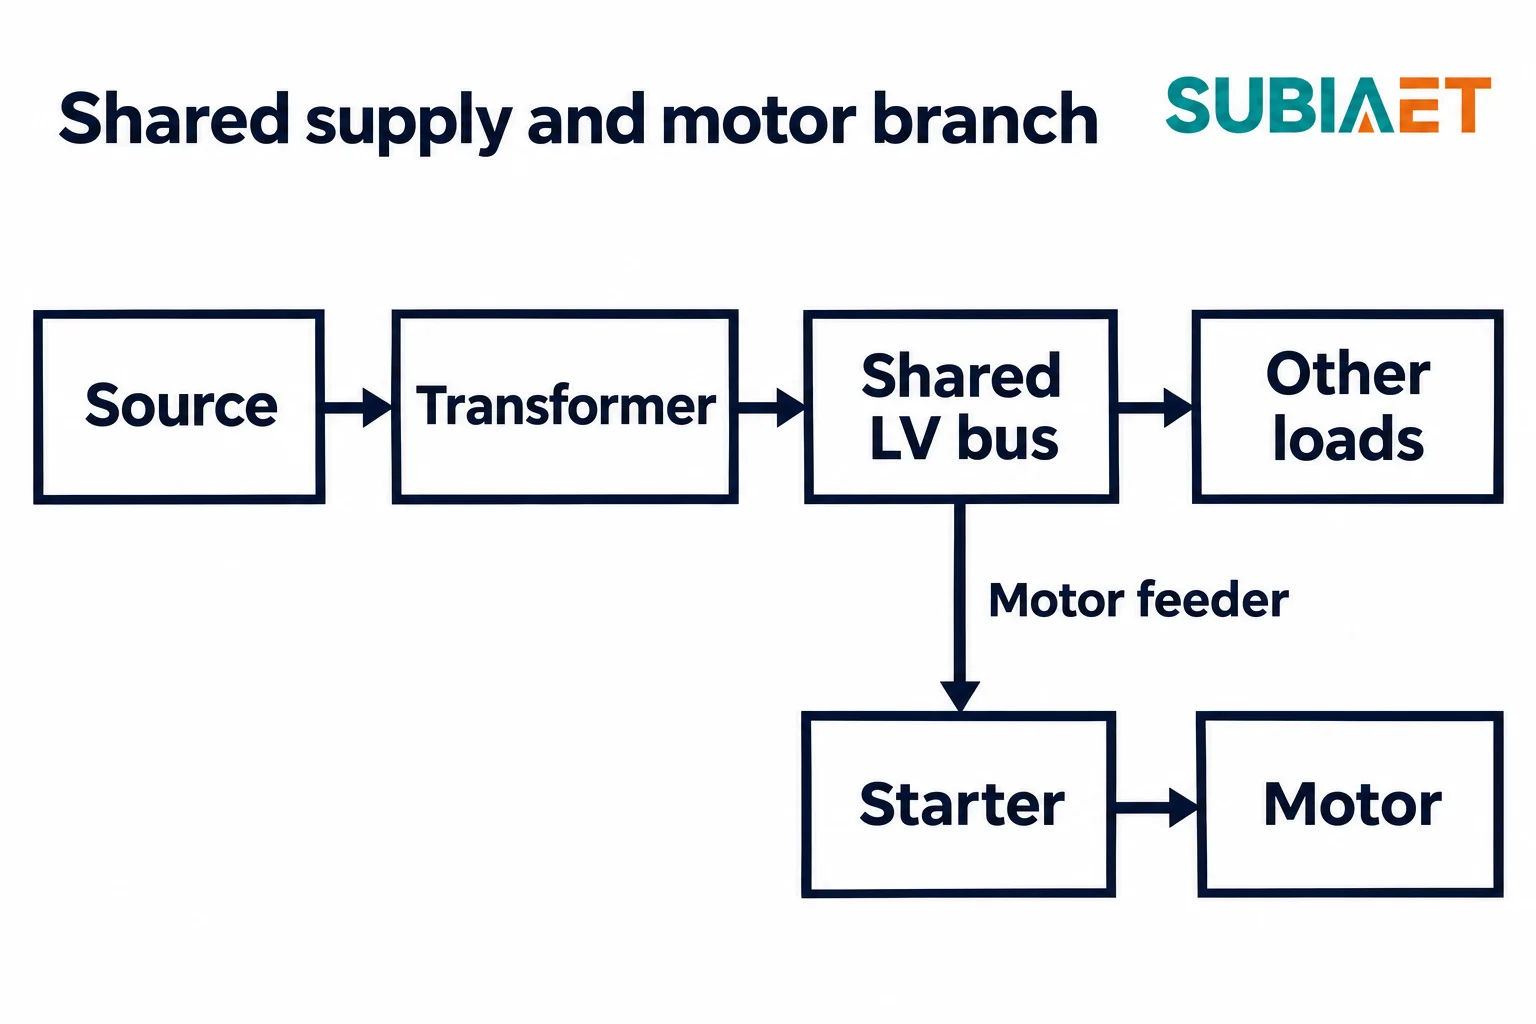
The voltage at the motor terminals depends on the supply path and on the current through each part of it. That path has a shape worth drawing explicitly:
Source → Transformer → shared LV bus → motor feeder → starter → motor
The shared LV bus is the branch point. Everything upstream of it — utility infeed or generator, transformer, and applicable connections to the switchboard — is shared with other loads on that board. The motor feeder, starter and motor cable form the downstream path for this motor.
That geometry creates two distinct screening points:
There is a third point that is often skipped: the motor terminals, downstream of the starter. With DOL, they may be close to the starter-input voltage if the intervening drop is small. Include the starter and any output cable. Star-delta and soft starters need their actual connection and output-voltage relationship, while a drive needs a motor-side model. A screen that reports the starter-input voltage as motor-terminal voltage has skipped that part of the system.
The first-order relationship for a balanced three-phase series path is a longitudinal drop proportional to R cos φ + X sin φ, where R and X are path resistance and reactance and φ is the current phase angle. The angle determines how strongly each component contributes. Use actual starting power factor rather than a universal assumed range. Schneider Electric’s voltage-drop guide gives the relationship and separates distribution-board and cable drops.
The data that control the dip are therefore:
The reason this matters beyond the starting motor is that the dip is shared. When the motor pulls current through the source and transformer impedance, voltage at the shared bus can fall for other loads. Contactors may drop out, a running drive may trip on undervoltage, or a control supply may experience a dip. Check each affected load’s terminal voltage and tolerance rather than assuming the motor is the only concern.
Improving the dip by lowering impedance is one possible lever, but it has a separate consequence: a reduction in transformer impedance on a common base can increase its contribution to prospective fault current. Fault duty, equipment ratings and coordination need their own assessment alongside the starting study.
The following example shows the mechanics of a first-order screen on one consistent base. Every number is an assumption constructed for the illustration; none is a project limit or a product rating.
The base. A hypothetical balanced three-phase system rated 500 kVA at 400 V line-to-line. The base current is:
I_base = 500,000 VA / (√3 × 400 V) = 721.7 A
On this 500 kVA / 400 V LV-referred base, the series impedances are:
| Element | R on common base | X on common base |
|---|---|---|
| Source | 0.40% | 1.96% |
| Transformer | 1.00% | 4.90% |
| Motor feeder | 0.90% | 1.20% |
Adding source and transformer gives R = 1.40%, X = 6.86% to the shared LV bus. Adding the feeder gives R = 2.30%, X = 8.06% to the starter input. The example includes shared supply connections in the stated source impedance.
If impedance data arrive on a different base, convert before adding: Z% on the new base equals Z% on the old base multiplied by the ratio of new to old kVA and by the square of the ratio of old to new voltage. Adding percentages from different bases can invalidate the calculation. Keep all path elements referred to the same voltage side.
The load context. Total simultaneous running load including this motor is 320 kVA, about 64% of the transformer rating. That supplies running-load context, not proof of thermal suitability at the site. Existing loads are represented by the pre-start state, with their currents held fixed, so the screen adds only the incremental starting current against the same impedance. This is a first-order projection, not a full network solution.
The currents. Compare two incremental line currents, both treated as fundamental RMS at an assumed 0.35 lagging power factor for this calculation, giving cos φ = 0.35 and sin φ ≈ 0.93675:
The estimate. On the stated common impedance base, the additional dip as a percentage of nominal voltage is:
ΔU% ≈ (I / I_base) × (R% × cos φ + X% × sin φ)
The bracketed term is the percent drop at base current; scaling by I/I_base gives the first-order drop at the assumed current.
One substitution in full, at the shared bus, 600 A:
ΔU% = (600 / 721.7) × (1.40 × 0.35 + 6.86 × 0.93675)
ΔU% ≈ 0.8314 × (0.490 + 6.426)
ΔU% ≈ 0.8314 × 6.916 = 5.75%
At the starter input, 600 A, use the cumulative path:
ΔU% ≈ 0.8314 × (2.30 × 0.35 + 8.06 × 0.93675)
ΔU% ≈ 0.8314 × (0.805 + 7.550)
ΔU% ≈ 0.8314 × 8.355 = 6.95%
At 360 A, the current ratio is 360 / 721.7 ≈ 0.4988, and the same paths give:
ΔU% ≈ 0.4988 × 6.916 = 3.45% at the shared bus
ΔU% ≈ 0.4988 × 8.355 = 4.17% at the starter input
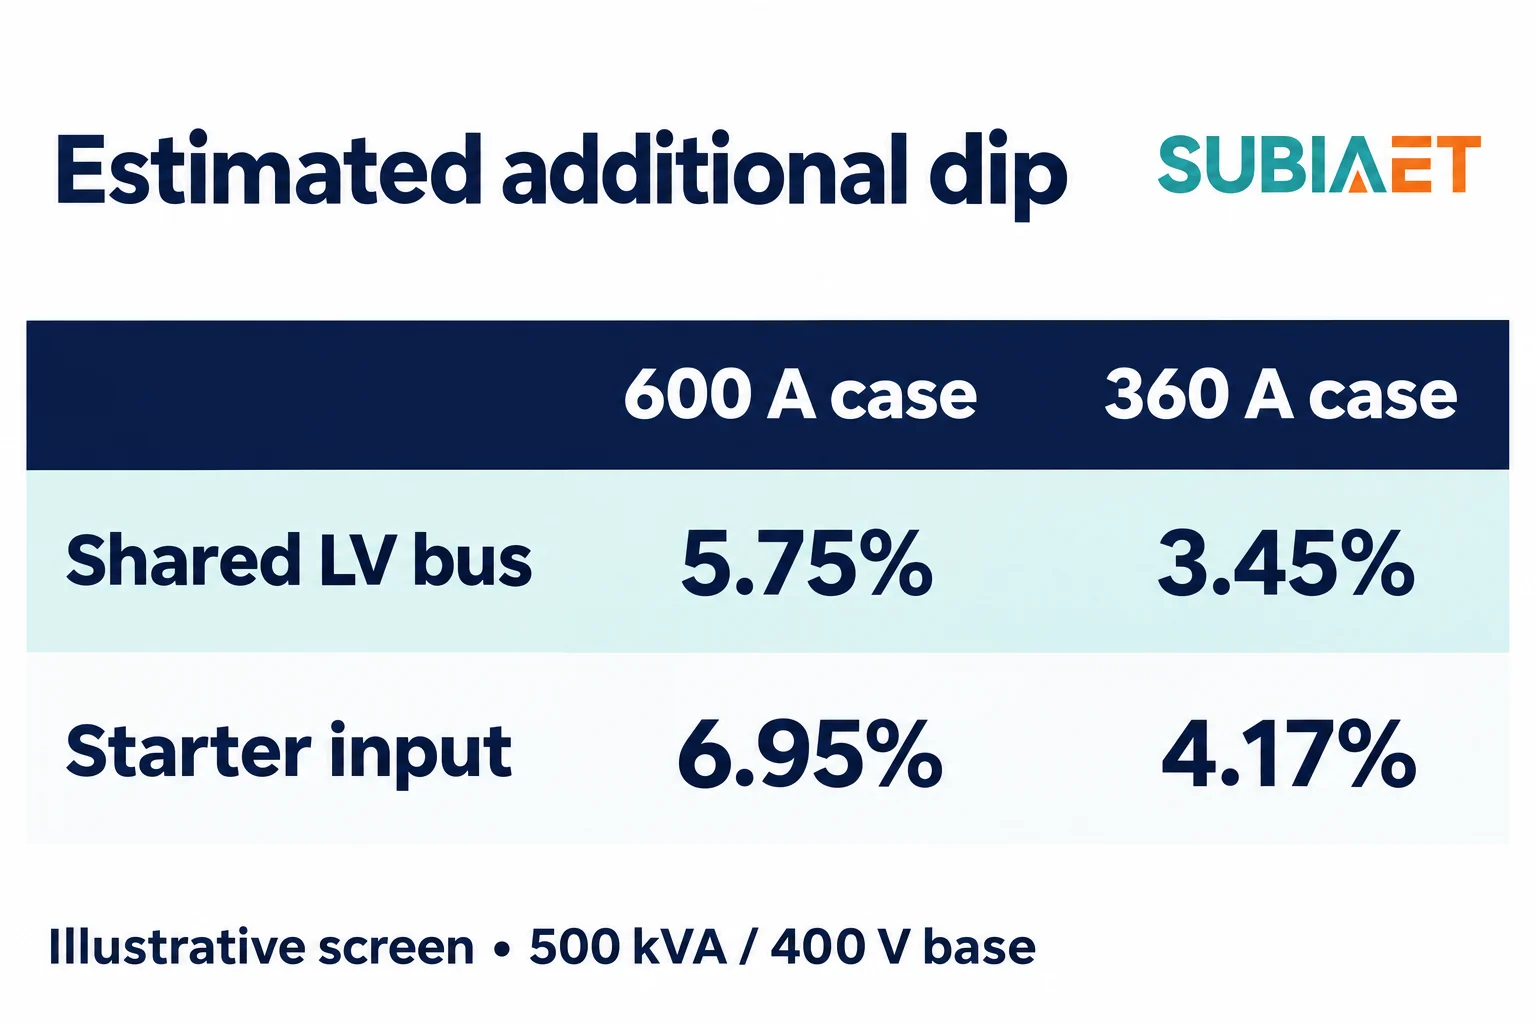
Interpretation. Suppose the project adopts illustrative additional-dip allowances of 5% at the shared bus and 6% at the starter input. Both are assumptions for this example, not limits from a standard, guide or product document. The 600 A case exceeds both allowances; the 360 A case is below both and can be taken forward for study. The transformer accounts for 4.90 of the 6.86 percentage points of bus reactance in this particular path. That identifies a substantial contribution in this example, not a universal ranking of transformer, source and feeder effects.
That is where the screen’s authority ends. Three things must be kept apart from it:
A transformer-only shortcut uses motor locked-rotor current divided by transformer secondary rated current, multiplied by transformer percent impedance. Schneider Electric’s transformer-only screen illustrates this limited approach. It leaves out the upstream source and feeder and does not establish motor-side dynamics. Use the transformer impedance explanation to keep the base and R/X interpretation consistent.
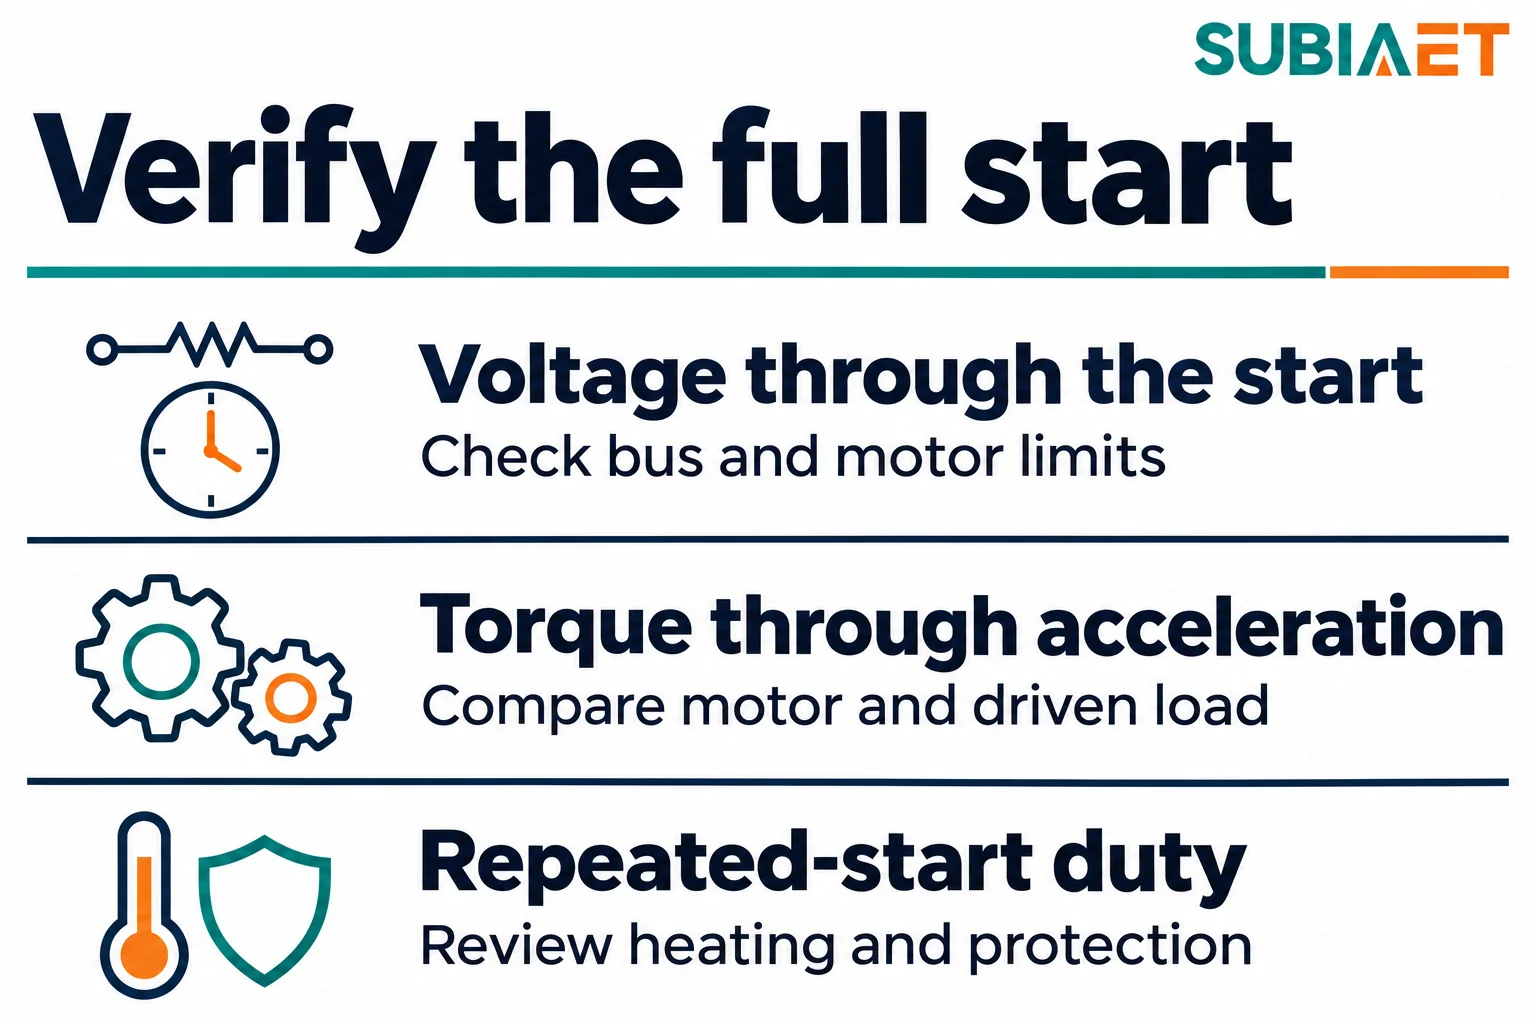
The screening calculation tells you whether a start is close to its allowance under the stated assumptions. It does not tell you how the motor behaves. Before any equipment decision — a different starter, a larger transformer, a bigger feeder — assemble the inputs for an actual study.
Source. For a utility supply: the short-circuit level and X/R at the point of supply, expressed as an equivalent impedance on the same base as everything else. For a generator: subtransient and transient reactance, excitation and voltage regulator response, other relevant control response, and the generator’s loading at the moment of the start. The source mode matters as much as the source data: normal infeed, alternate infeed, generator, or a transfer between them can give different answers, and the governing case is not always obvious.
Pre-start conditions. The minimum credible pre-start bus voltage and the coincident load that produces it. Assess credible combinations of source strength and production loading instead of assuming one nominal case governs.
Transformer. Rating, percent impedance, resistance-to-reactance split, tap range and the tap actually in service, winding configuration and the base and reference conditions on which the impedance is quoted.
Feeder. Conductor size and material, length, number of parallel runs, and the resulting R and X from the bus to the starter input. Include shared connections and cable on the starter output where present.
Motor. Rated output and voltage, locked-rotor current and its power factor at the stated voltage, current-versus-speed and torque-versus-speed characteristics, permissible starts and thermal limit, and moment of inertia — of the motor alone and of the motor plus driven machine, with their bases clearly identified.
Driven load. Obtain torque-versus-speed and inertia for the machine being accelerated. If a reduced-load start is permitted by the process, use its actual conditions and explain how that state is achieved. Do not assume a generic valve, belt or unloader instruction applies to every machine.
Starter. Type, the manufacturer’s line-side input current data at the intended settings, the output voltage range, and the current limit or ramp profile. For a drive, the input current at the actual load and the harmonic content the supply will see.
Sequence and duty. Establish which motors start in what order, the intervals and overlap, starts per hour, and the applicable equipment and protection limits. Repeated or prolonged starts require assessment of motor, starter, transformer and protection duty; heating cannot be inferred from start time alone.
Limits by node and by time. A motor terminal voltage limit during acceleration, a shared-bus limit for other loads, a starter-input limit and the permissible duration at each location, together with the acceptance criteria the project has actually agreed. Include any applicable utility limit at the connection point.
With those inputs, compare options against the location that drives the decision:
A static locked-rotor estimate and a dynamic acceleration study answer different questions. The static estimate answers “how deep, roughly, and where”. The dynamic study examines whether the motor accelerates, how long it takes, what the relevant nodes see over time, and how the protection responds. Reach for the dynamic study when the static screen sits close to its allowance, when the driven load is high-inertia or loaded at standstill, when the source is a generator, when other loads on the bus are sensitive, or when starts are frequent enough for accumulated heating to matter.
Eaton’s motor-starting analysis overview shows how those outputs complement a locked-rotor screen. Review voltage at each relevant node versus time, motor torque against driven-load torque versus speed, acceleration time, behavior of other controls and thermal and protection duty across the required starts.
An enquiry based only on running kVA leaves starting duty unexamined. Bring the motor data, number and sequence of starts, source modes and strength, pre-start voltage, transformer and conductor impedance, and the agreed voltage and duration limits.
For the surrounding workflow, see SUBIA’s transformer range, industrial facilities application page and factory expansion running-capacity example. The kVA, kW and power-factor guide explains running quantities, while industrial transformer selection puts both studies into the wider procurement brief.
Running kVA describes the continuous loading case. Starting adds a short period of higher current through the supply impedance. The resulting voltage dip can reduce motor torque and disturb other equipment on the same bus.
Yes. Compare their resistance and reactance on the same base and at the applicable tap. Include the upstream source, feeder and starting current to estimate the voltage at the required location.
Check the motor torque available with that starter against driven-load torque across the speed range. The torque margin and inertia determine acceleration time, which must also fit the thermal and protection limits.
Check the shared bus for other loads, the starter input for the starting equipment, and the motor terminals for motor performance. Apply the agreed voltage and duration limit at each location.